


WELCOME
About this website and its origins
East Suffolk recorded its first known case of the Coronavirus (Covid-19) on March 11th 2020 in a person within the 55 to 59 age group. In July that year I began keeping records of how Coronavirus had evolved and was continuing to do so, within England’s Lower Tier Local Authority (LTLA) area of East Suffolk, where I live, and which has a population of just over a quarter of a million (mid-2020 Office for National Statistics estimate). These records also include statistics for the thirty much smaller Middle Super Output Area’s (MSOA’s) within the East Suffolk LTLA, each of which has a population averaging just over 8,000, within a range from just under 6,000 to over 13,000. The population of each MSOA is shown in the 8-week chart on the MSOA page.Publishing of the data
In February 2021, I decided to publish these records online by making use of charts and graphs taken from my workbooks to present these sets of Covid-19 statistics mainly relevant to the East Suffolk LTLA. All the records are created in Microsoft Excel Workbooks, using the data from .csv files which are made available by and downloaded from the UKHSA* website on GOV.UK and which are currently updated weekly on a Thursday evening. The time of the updates on here may vary depending on the time the data is made available on the UKHSA website and the time it takes for me to process. The ‘LINKS’ page contains links to all the Excel Workbooks from where the graphs and charts displayed on these pages are taken. These .xlsx workbooks can be viewed as ‘read-only’ Excel documents and will open in a new browser tab or window. Further details about these are given on the ‘LINKS’ page. Images of graphs and charts can be enlarged by clicking them. Some of the images can also be enlarged further. Where a large ‘X’ appears at the bottom right of an enlarged image when the mouse is hovering over it, just click on the ‘X’. This can be particularly useful on mobile devices such as phones. Carlton Colville, February 2021 (Updated - October 2023) *United Kingdom Health & Security Agency

Covid-19 in East Suffolk

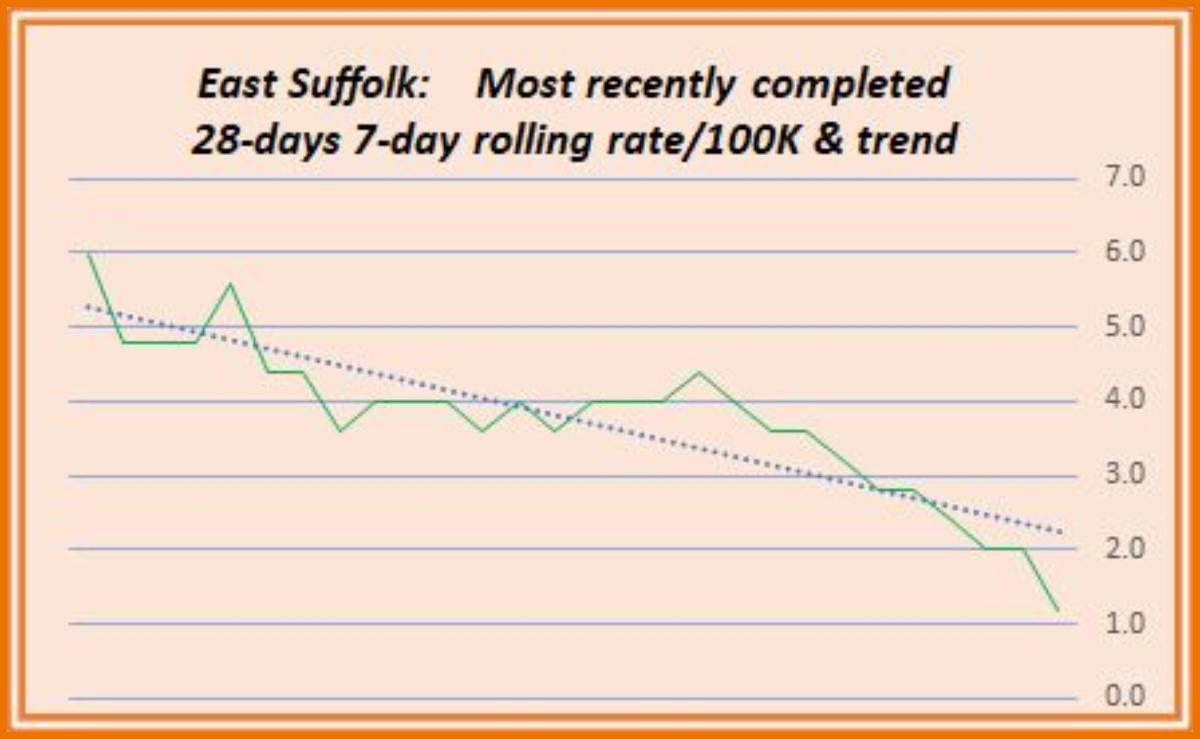
East Suffolk - latest 7-day statistics
Reporting Date: 14 November 2024 *Rolling rate: 1.2 per100K (6 Vov 2024) -2.4 on previous week [-66.7%] All cases reported in last 7 days: 3 (-2 on previous 7-days) *Rate is 8-days prior to Reporting Date
Covid-19 in East Suffolk

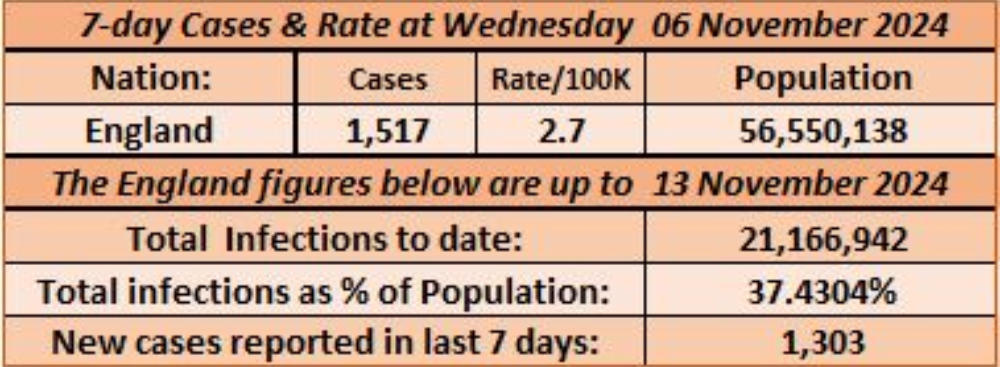
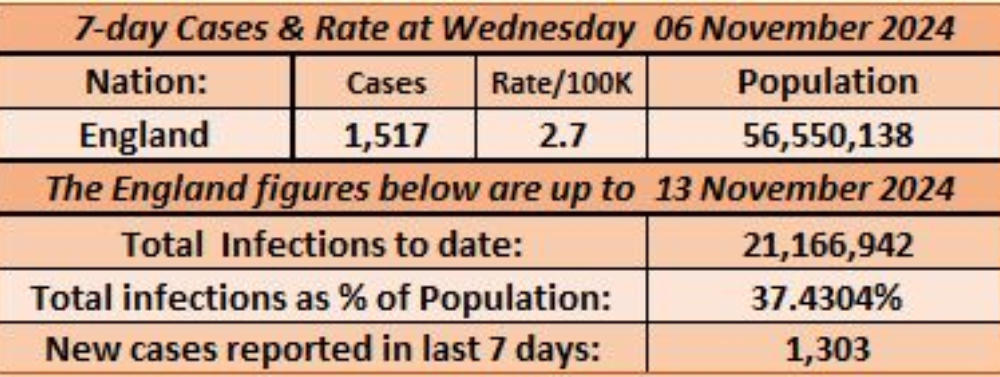
Latest England Statistics reported on
14 November 2024
18t

Contains MSOA names © Open Parliament copyright and database right 2020.
Contains Public Health England data © Crown Copyright and databases right 2020 .
Office for National Statistics licensed under the Open Government Licence v.3.0
Disclaimer: Whilst every effort has been made to ensure the data published on these pages is accurate,
I cannot accept responsibility for any inaccuracies in the data used to compile the graphs and charts.
© 2020 - 2024

Charts & Graphs were last updated
14 November 2024 at 19:00
NOTE: Only the first FOUR pages, marked with an asterisk (*) in the Navigation Menu, are now being updated


WELCOME
About this website and its origins
East Suffolk recorded its first known case of the Coronavirus (Covid-19) on March 11th 2020 in a person within the 55 to 59 age group. In July that year I began keeping records of how Coronavirus had evolved and was continuing to do so, within England’s Lower Tier Local Authority (LTLA) area of East Suffolk, where I live, and which has a population of just over a quarter of a million (mid-2020 Office for National Statistics estimate). These records also include statistics for the thirty much smaller Middle Super Output Area’s (MSOA’s) within the East Suffolk LTLA, each of which has a population averaging just over 8,000, within a range from just under 6,000 to over 13,000. The population of each MSOA is shown in the 8-week chart on the MSOA page.Publishing of the data
In February 2021, I decided to publish these records online by making use of charts and graphs taken from my workbooks to present these sets of Covid-19 statistics mainly relevant to the East Suffolk LTLA. All the records are created in Microsoft Excel Workbooks, using the data from .csv files which are made available by and downloaded from the UKHSA* website on GOV.UK and which are currently updated weekly on a Thursday evening. The time of the updates on here may vary depending on the time the data is made available on the UKHSA website and the time it takes for me to process. The ‘LINKS’ page contains links to all the Excel Workbooks from where the graphs and charts displayed on these pages are taken. These .xlsx workbooks can be viewed as ‘read-only’ Excel documents and will open in a new browser tab or window. Further details about these are given on the ‘LINKS’ page. Images of graphs and charts can be enlarged by clicking them. Some of the images can also be enlarged further. Where a large ‘X’ appears at the bottom right of an enlarged image when the mouse is hovering over it, just click on the ‘X’. This can be particularly useful on mobile devices such as phones. Carlton Colville, February 2021 (Updated - October 2023) *United Kingdom Health & Security Agency

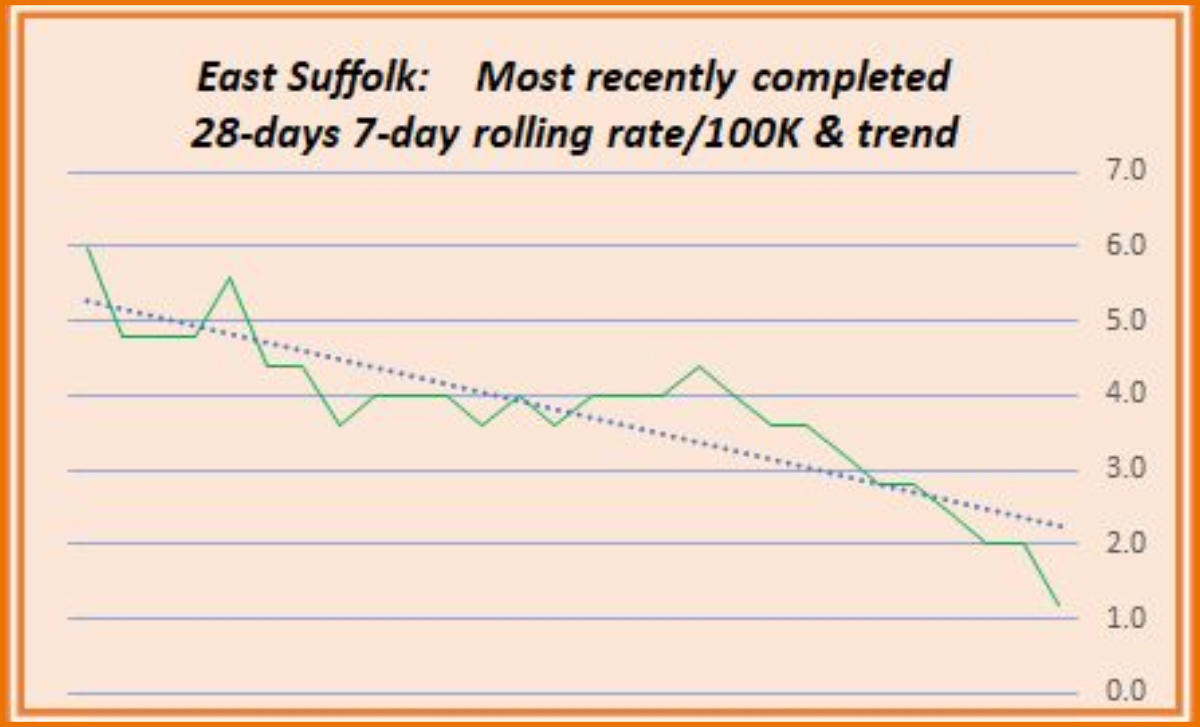

East Suffolk - latest 7-day statistics
Reporting Date: 14 November 2024 *Rolling rate: 1.2 per100K (6 Vov 2024) -2.4 on previous week [-66.7%] All cases reported in last 7 days: 3 (-2 on previous 7-days) *Rate is 8-days prior to Reporting Date
Covid-19
in East Suffolk

Latest England Statistics reported on
14 November 2024
18t

Contains MSOA names © Open Parliament copyright and database right 2020.
Contains Public Health England data © Crown Copyright and databases right 2020 .
Office for National Statistics licensed under the Open Government Licence v.3.0
Disclaimer: Whilst every effort has been made to ensure the data published on these
pages is accurate, I cannot accept responsibility for any inaccuracies in the data used
to compile the graphs and charts.
© 2020 - 2024

Charts & Graphs were last updated
14 November 2024 at 19:00
NOTE: Only the first FOUR pages, marked with an asterisk (*)
in the Navigation Menu, are now being updated