


Covid-19 in East Suffolk
WEEKLY CASES & RATES
About the Chart & Graphs
The charts on this page include the data displayed in the graphs below. The full list of data from the first case is included in the relevant Excel Workbook which can be accessed as a ‘read only’ document in a browser window from the ‘LINKS’ page in the navigation bar.

Contains MSOA names © Open Parliament copyright and database right 2020.
Contains Public Health England data © Crown Copyright and databases right 2020 .
Office for National Statistics licensed under the Open Government Licence v.3.0
Disclaimer: Whilst every effort has been made to ensure the data published on these pages is accurate,
I cannot accept responsibility for any inaccuracies in the data used to compile the graphs and charts.
© 2020 - 2024

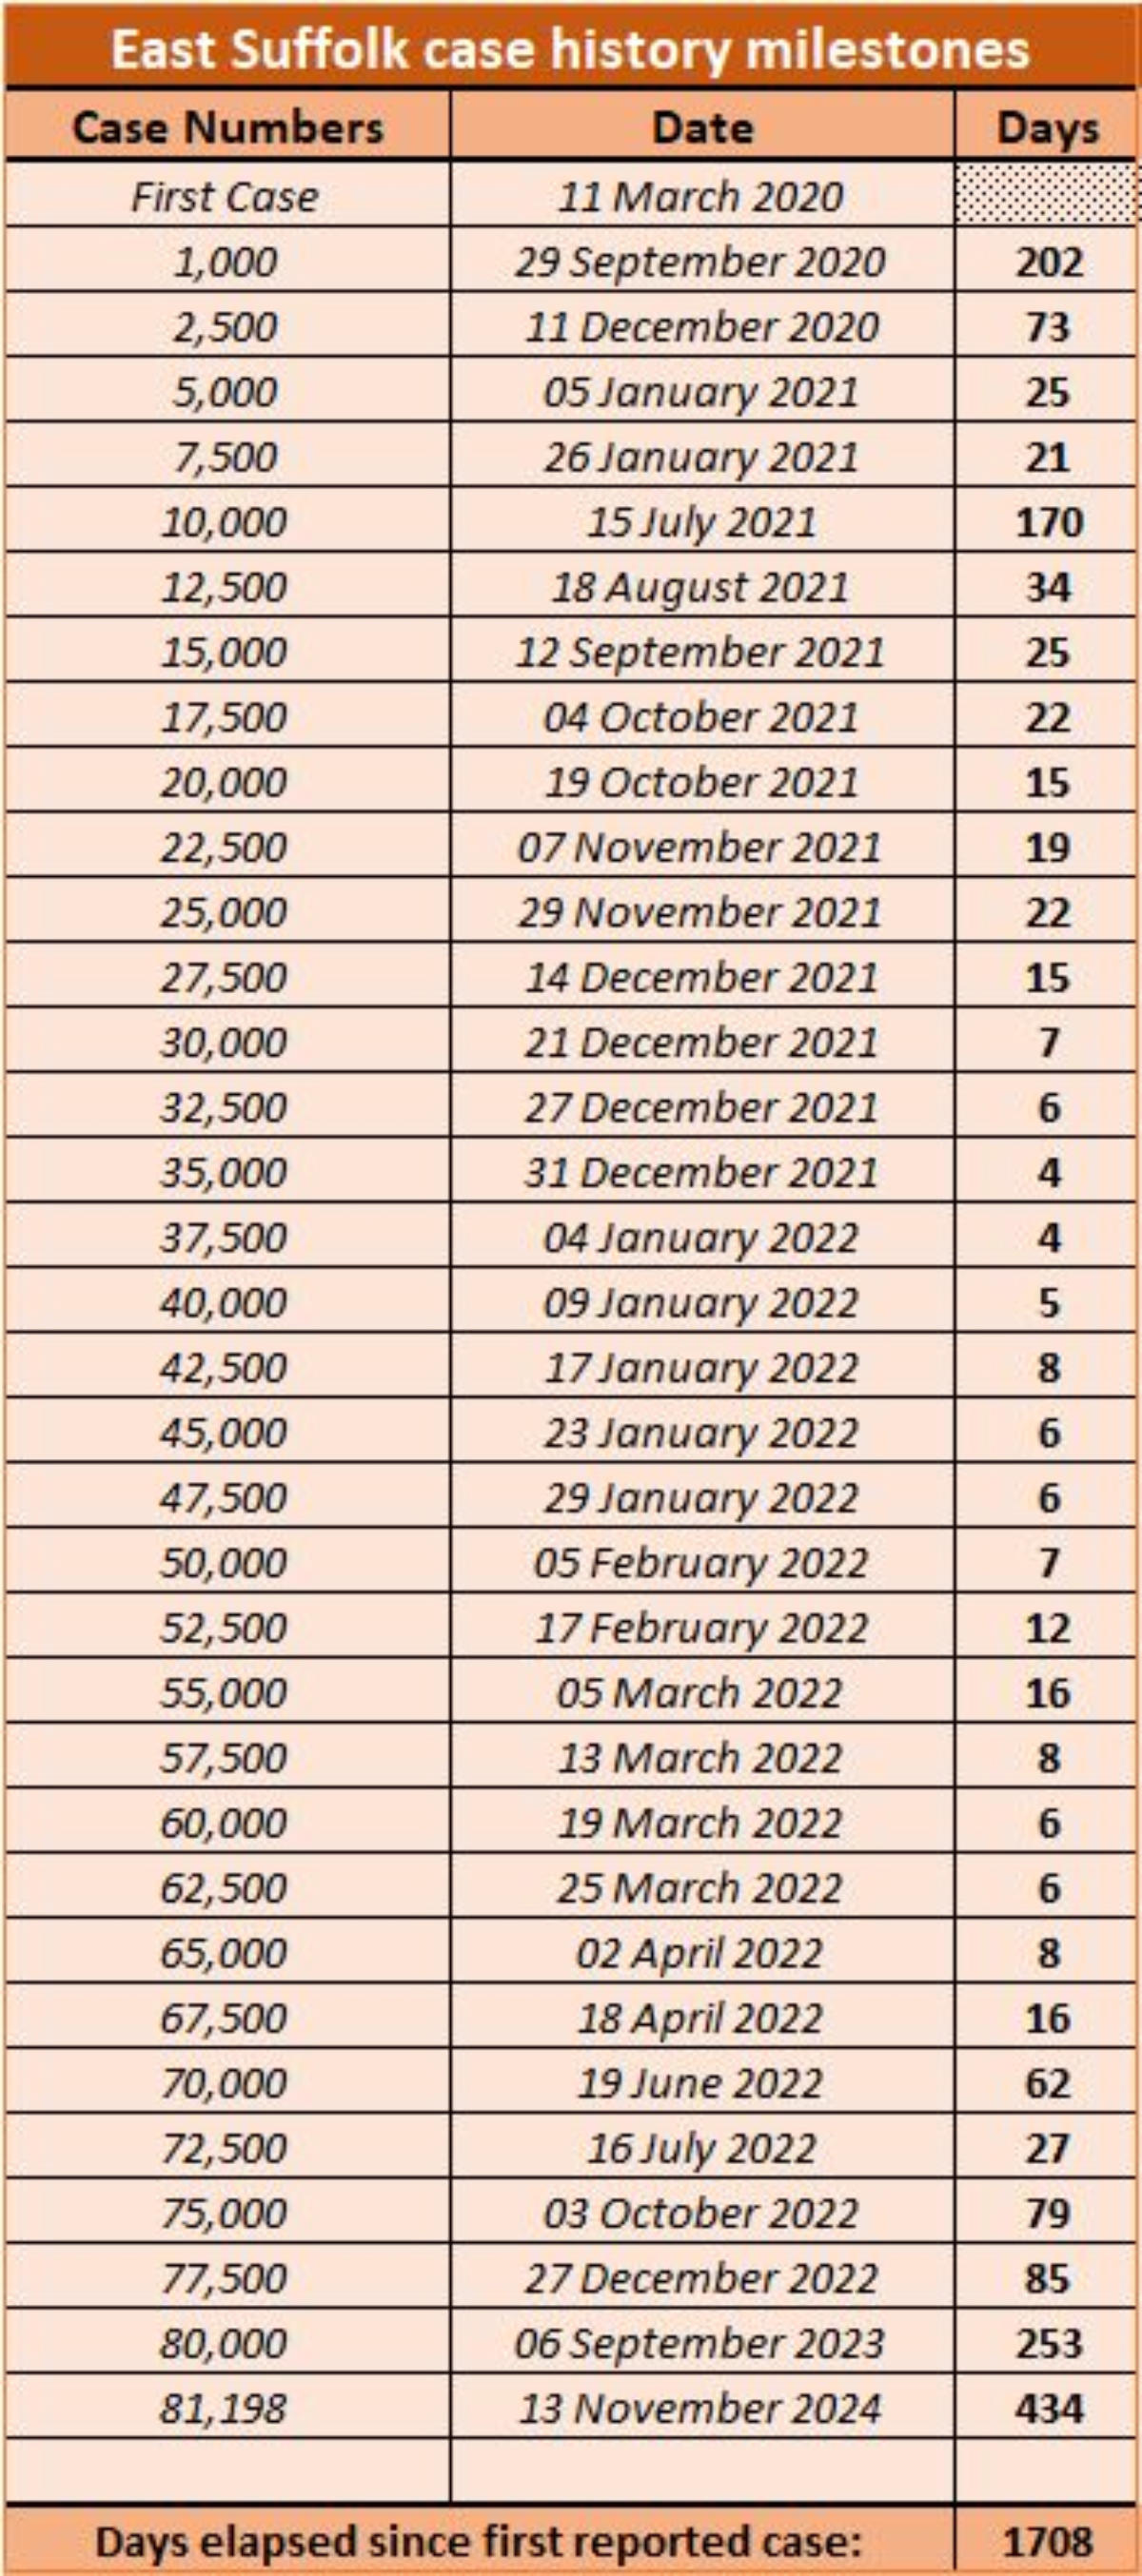
The
chart
below
displays
the
number
of
days
that
have
elapsed
between
each
2,500
new
cases, after the initial 1,000 case milestone.
MONTHLY CASES
The graph below displays the all-time monthly case data from the chart on the Home Page.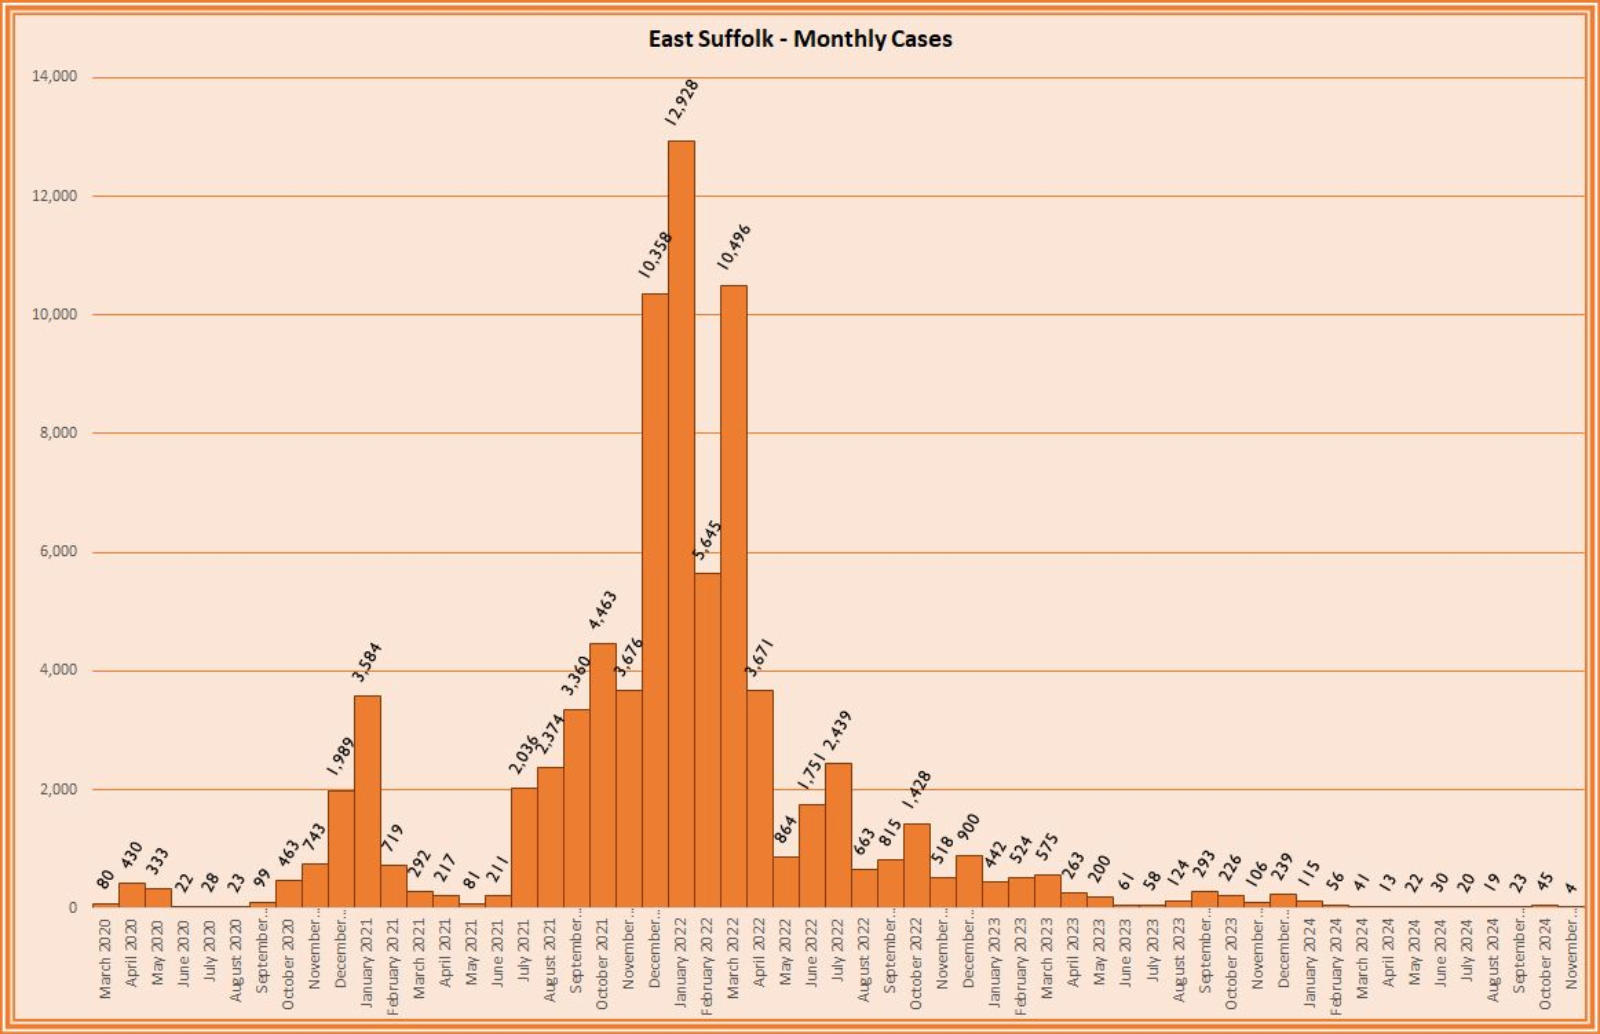
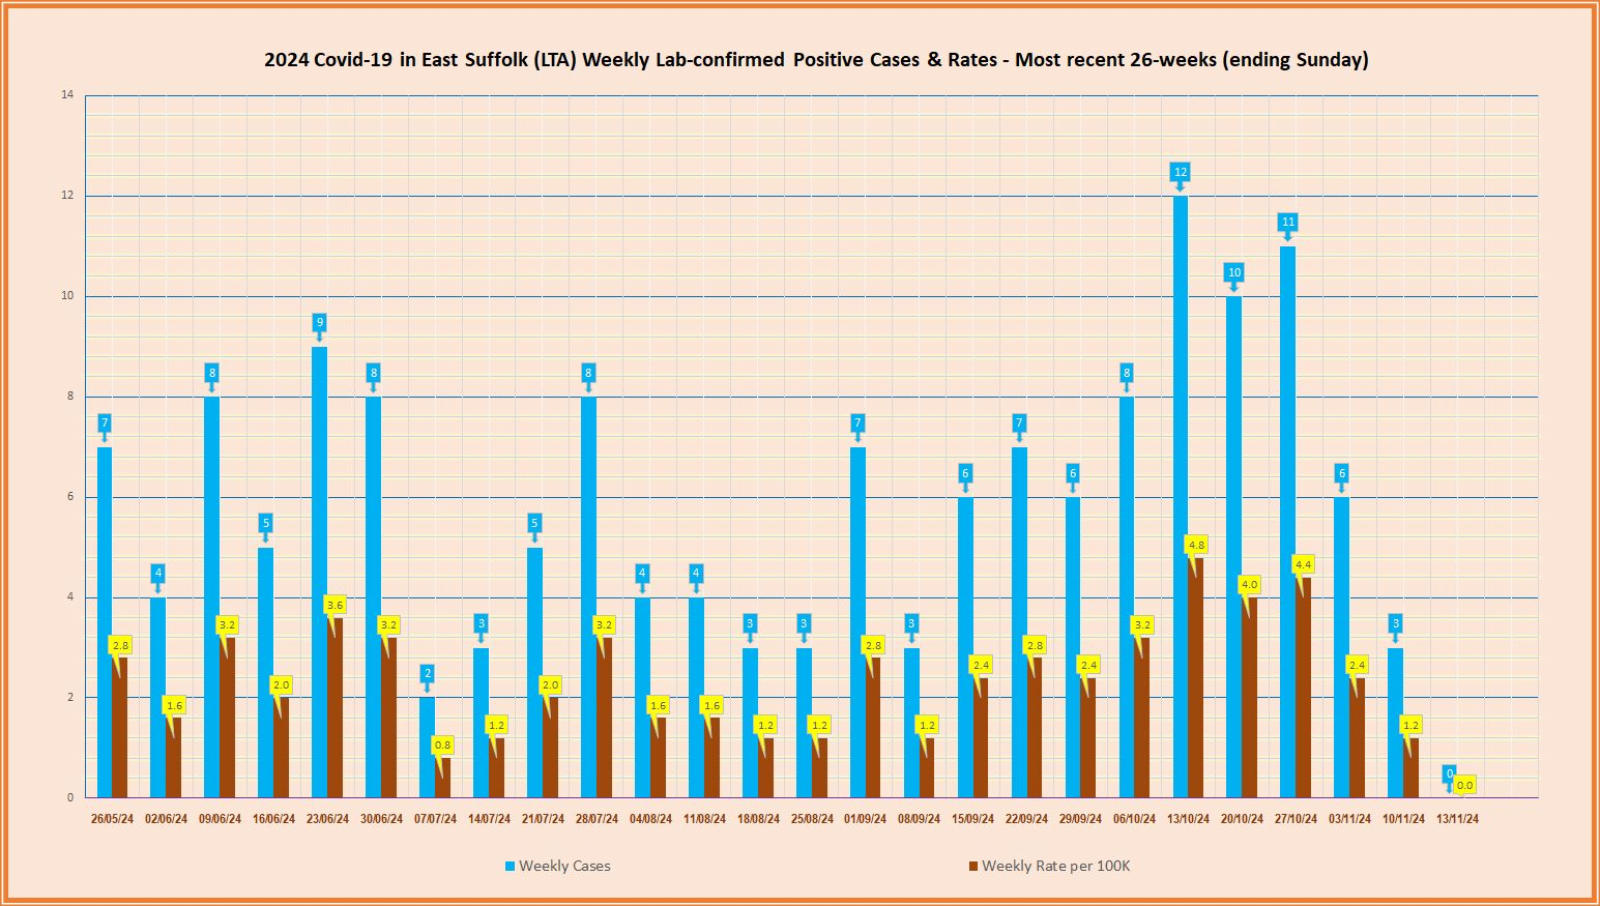
The chart below shows the most recent 26 weeks of case
data ending on a Sunday, with the exception of the most
recent week as indicated at the foot of the chart.


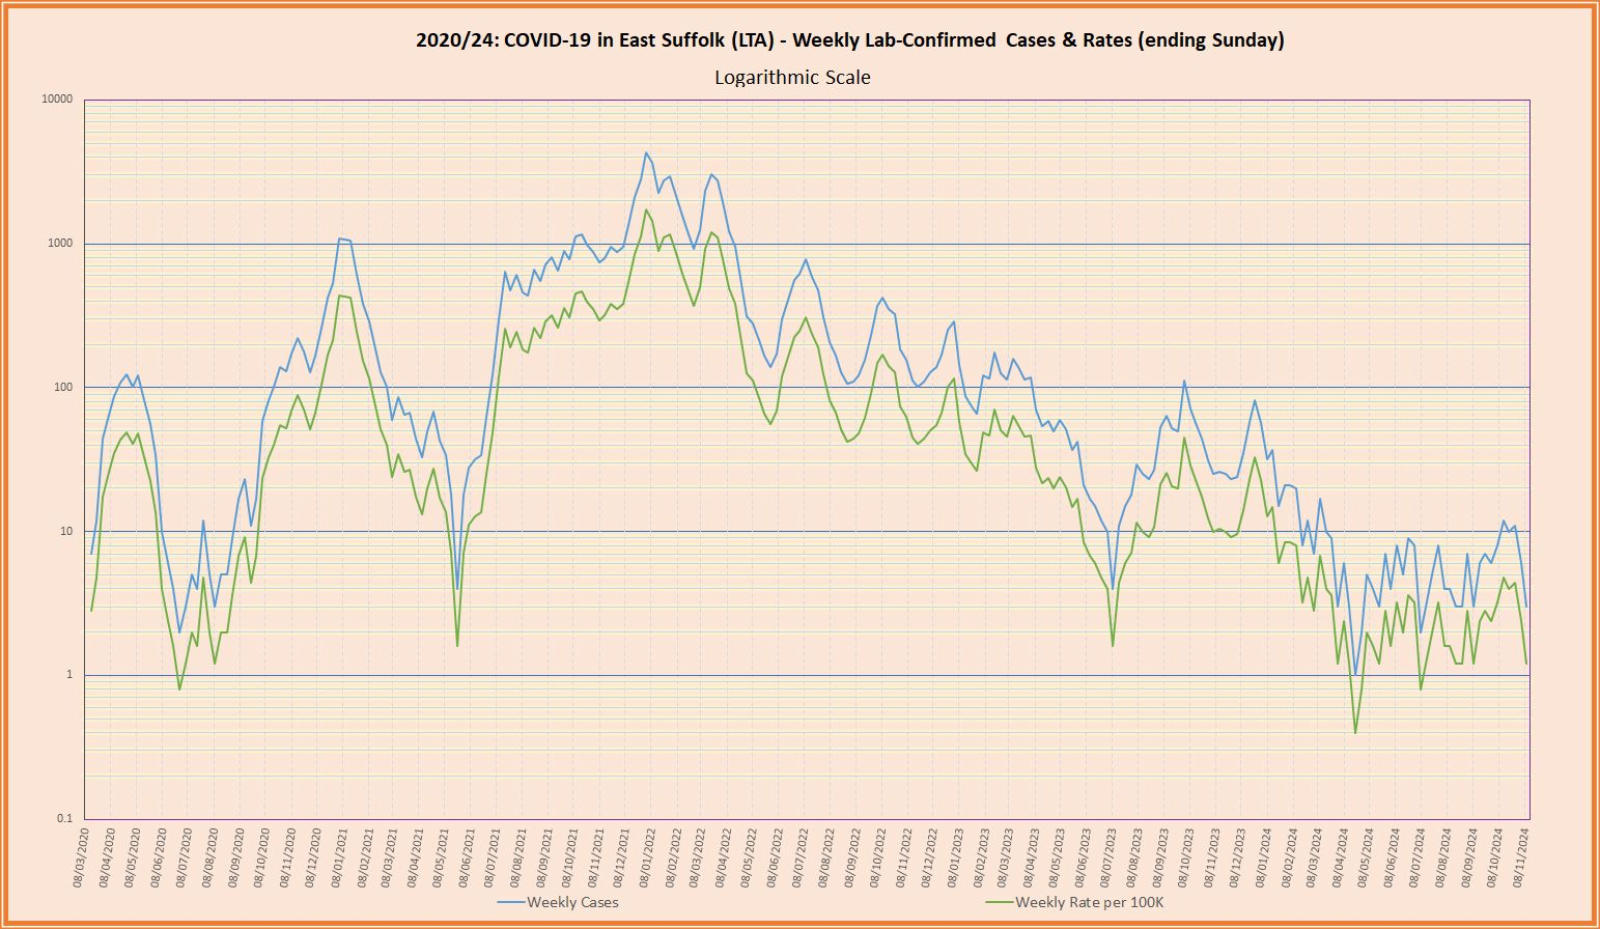
WEEKLY CASES & RATES
About the Chart & Graphs
The charts on this page include the data displayed in the graphs below. The full list of data from the first case is included in the relevant Excel Workbook which can be accessed as a ‘read only’ document in a browser window from the ‘LINKS’ page in the navigation bar.
Covid-19
in East Suffolk
Contains MSOA names © Open Parliament copyright and database right 2020.
Contains Public Health England data © Crown Copyright and databases right 2020 .
Office for National Statistics licensed under the Open Government Licence v.3.0
Disclaimer: Whilst every effort has been made to ensure the data published on these
pages is accurate, I cannot accept responsibility for any inaccuracies in the data used
to compile the graphs and charts.
© 2020 - 2024


This first chart shows the most recent 26 weeks of case
data ending on a Sunday, with the exception of the most
recent week as indicated at the foot of the chart.
_____________________________________________________