


Covid-19 in East Suffolk
DEATHS*
Chart & Graph
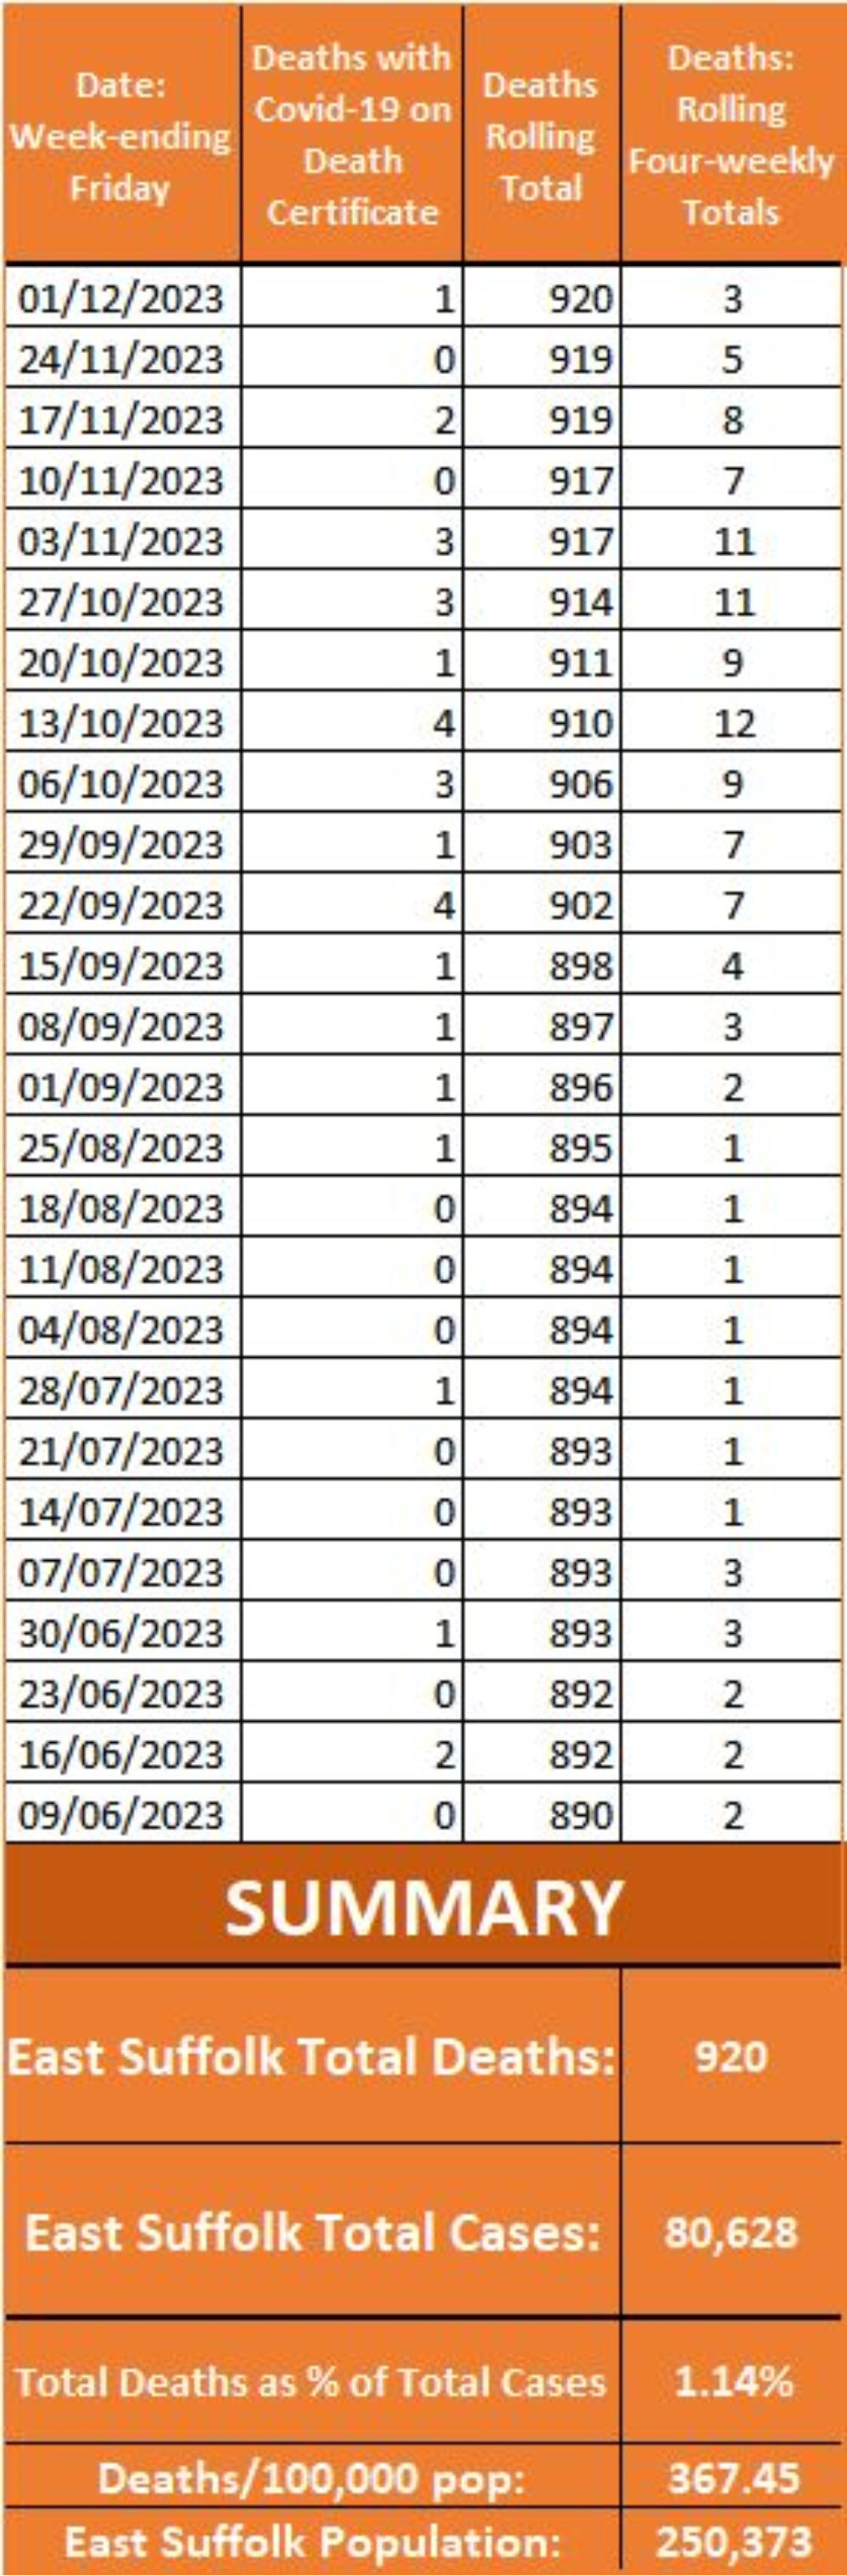
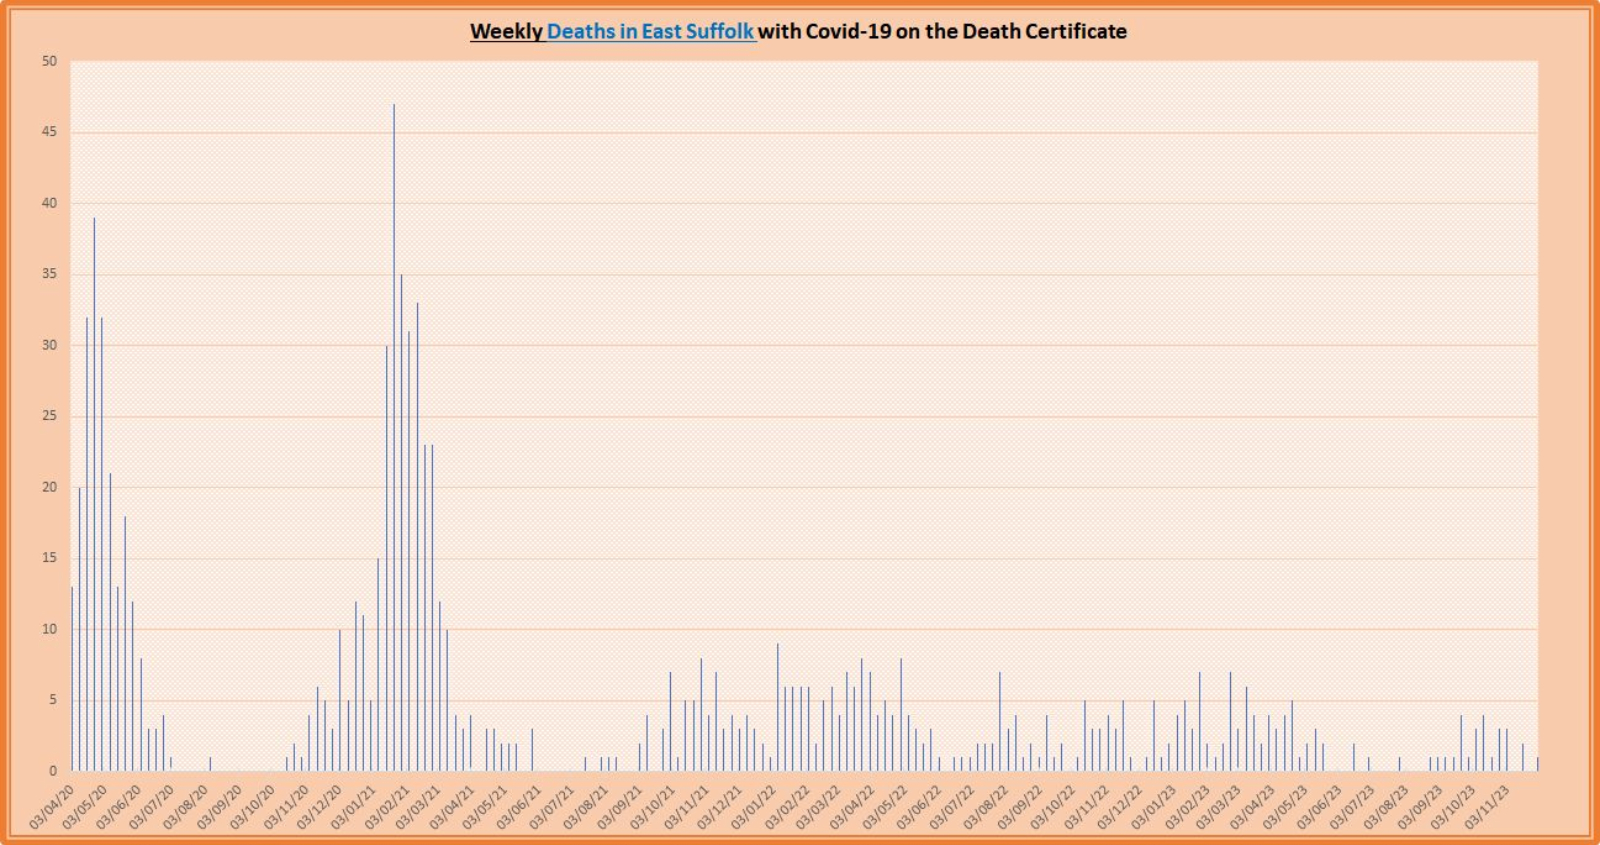
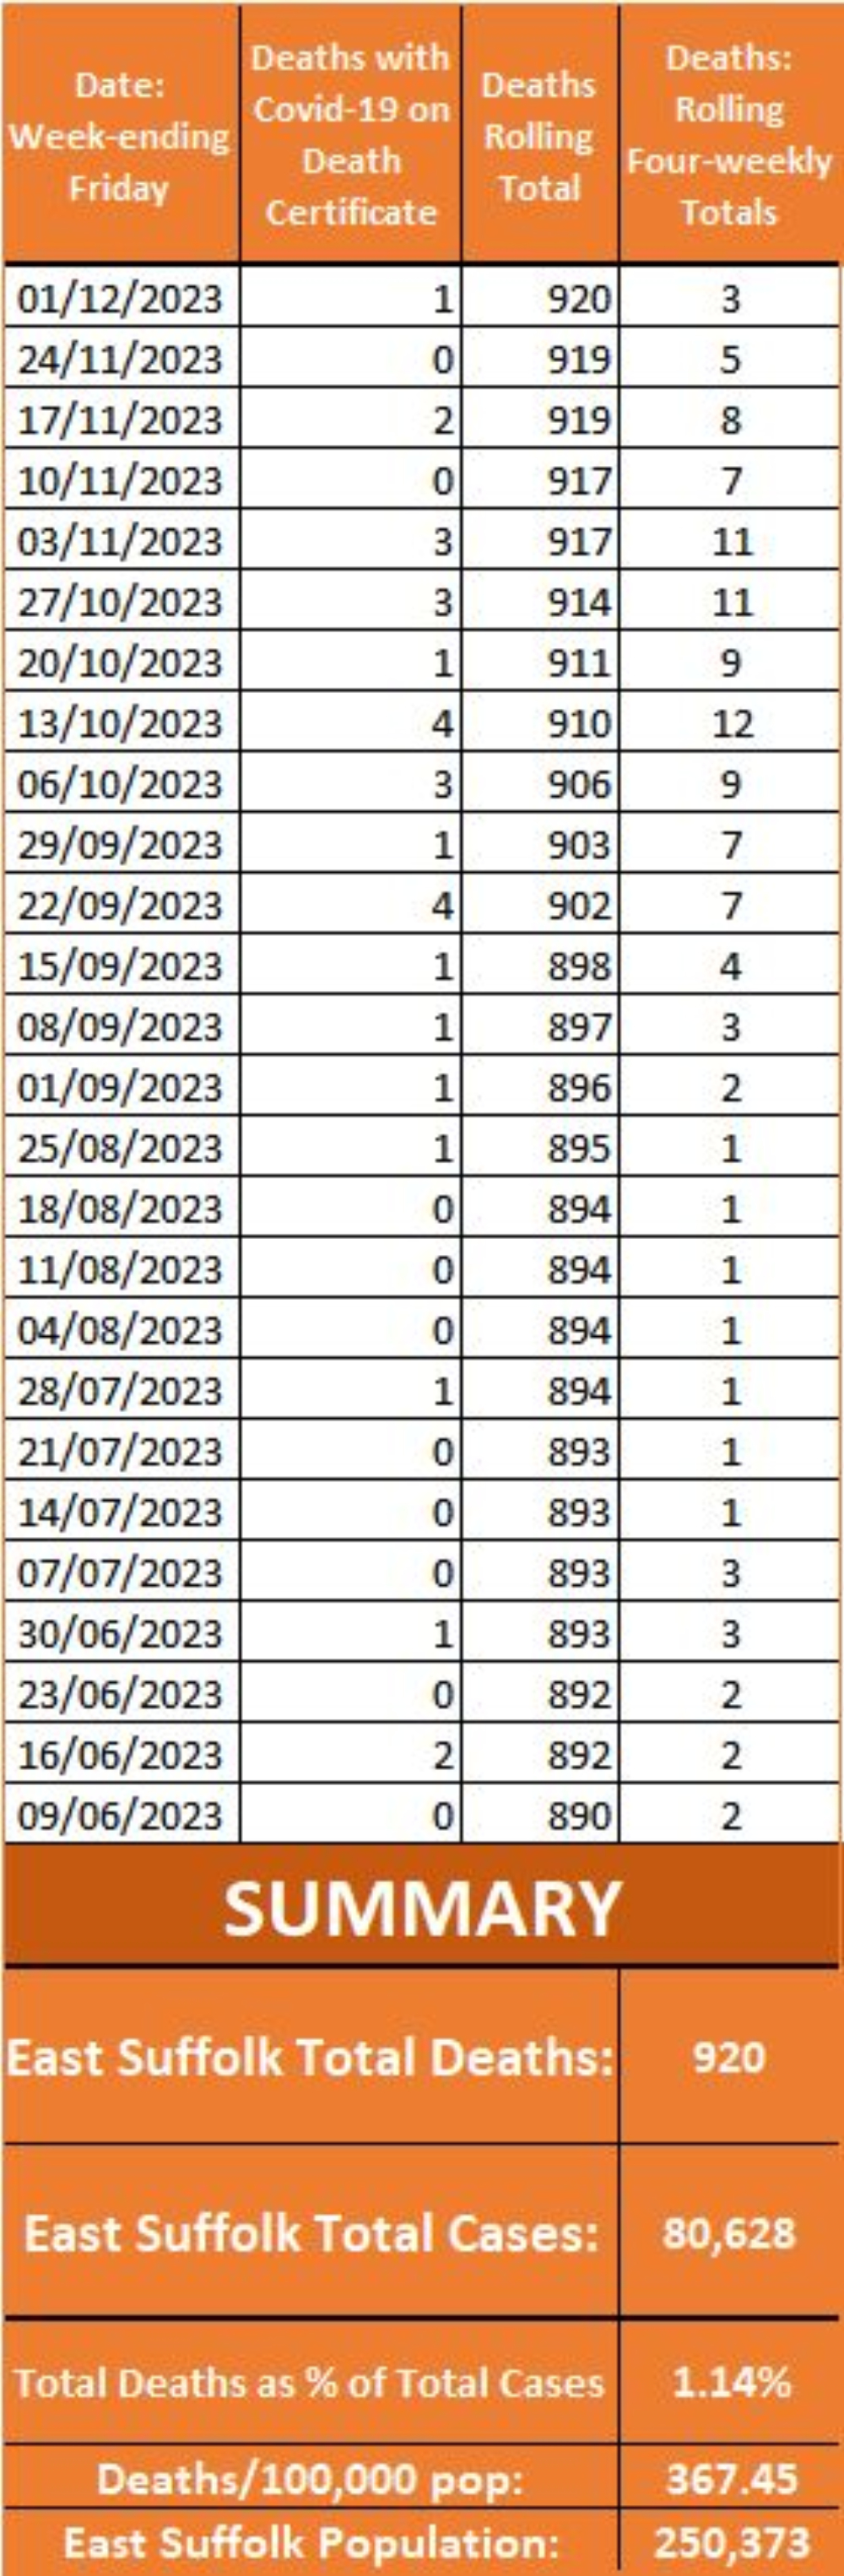
The chart on this page shows the WEEKLY deaths from Covid-19 that have been recorded in the most recent 26 weeks, where Covid-19 is recorded on the death certificate. At the foot of the chart is a summary of statistics since March 2020. The Graph below shows the daily deaths recorded for each week since March 2020 * NOTE: Reporting changed from July 2023 from deaths within 28 of a positive test, to Covid-19 being recorded on the death certificate. The complete chart displaying all the deaths statistics since March 2020 can be viewed in an Excel workbook ‘read-only’ document in a browser and is available from the ‘LINKS’ page.
Contains MSOA names © Open Parliament copyright and database right 2020.
Contains Public Health England data © Crown Copyright and databases right 2020 .
Office for National Statistics licensed under the Open Government Licence v.3.0
Disclaimer: Whilst every effort has been made to ensure the data published on these pages is accurate,
I cannot accept responsibility for any inaccuracies in the data used to compile the graphs and charts.
© 2020 - 2025

The updating of the charts/graphs on this page has now ceased as the data for them is no longer available.


DEATHS*
Chart & Graph
The chart on this page shows the WEEKLY deaths from Covid-19 that have been recorded in the most recent 26 weeks, where Covid-19 is recorded on the death certificate. At the foot of the chart is a summary of statistics since March 2020. The Graph below shows the daily deaths recorded for each week since March 2020 * NOTE: Reporting changed from July 2023 from deaths within 28 of a positive test, to Covid-19 being recorded on the death certificate. The complete chart displaying all the deaths statistics since March 2020 can be viewed in an Excel workbook ‘read-only’ document in a browser and is available from the ‘LINKS’ page.
Covid-19
in East Suffolk
Contains MSOA names © Open Parliament copyright and database right 2020.
Contains Public Health England data © Crown Copyright and databases right 2020 .
Office for National Statistics licensed under the Open Government Licence v.3.0
Disclaimer: Whilst every effort has been made to ensure the data published on these
pages is accurate, I cannot accept responsibility for any inaccuracies in the data used
to compile the graphs and charts.
© 2020 - 2025

The updating of the charts/graphs on this page has
now ceased as the data for them is no longer available.