


Covid-19 in East Suffolk
SUFFOLK (UTLA)
Combined Chart & Graphs showing cases for all five LTLA’s and the combined figure as
Suffolk UTLA
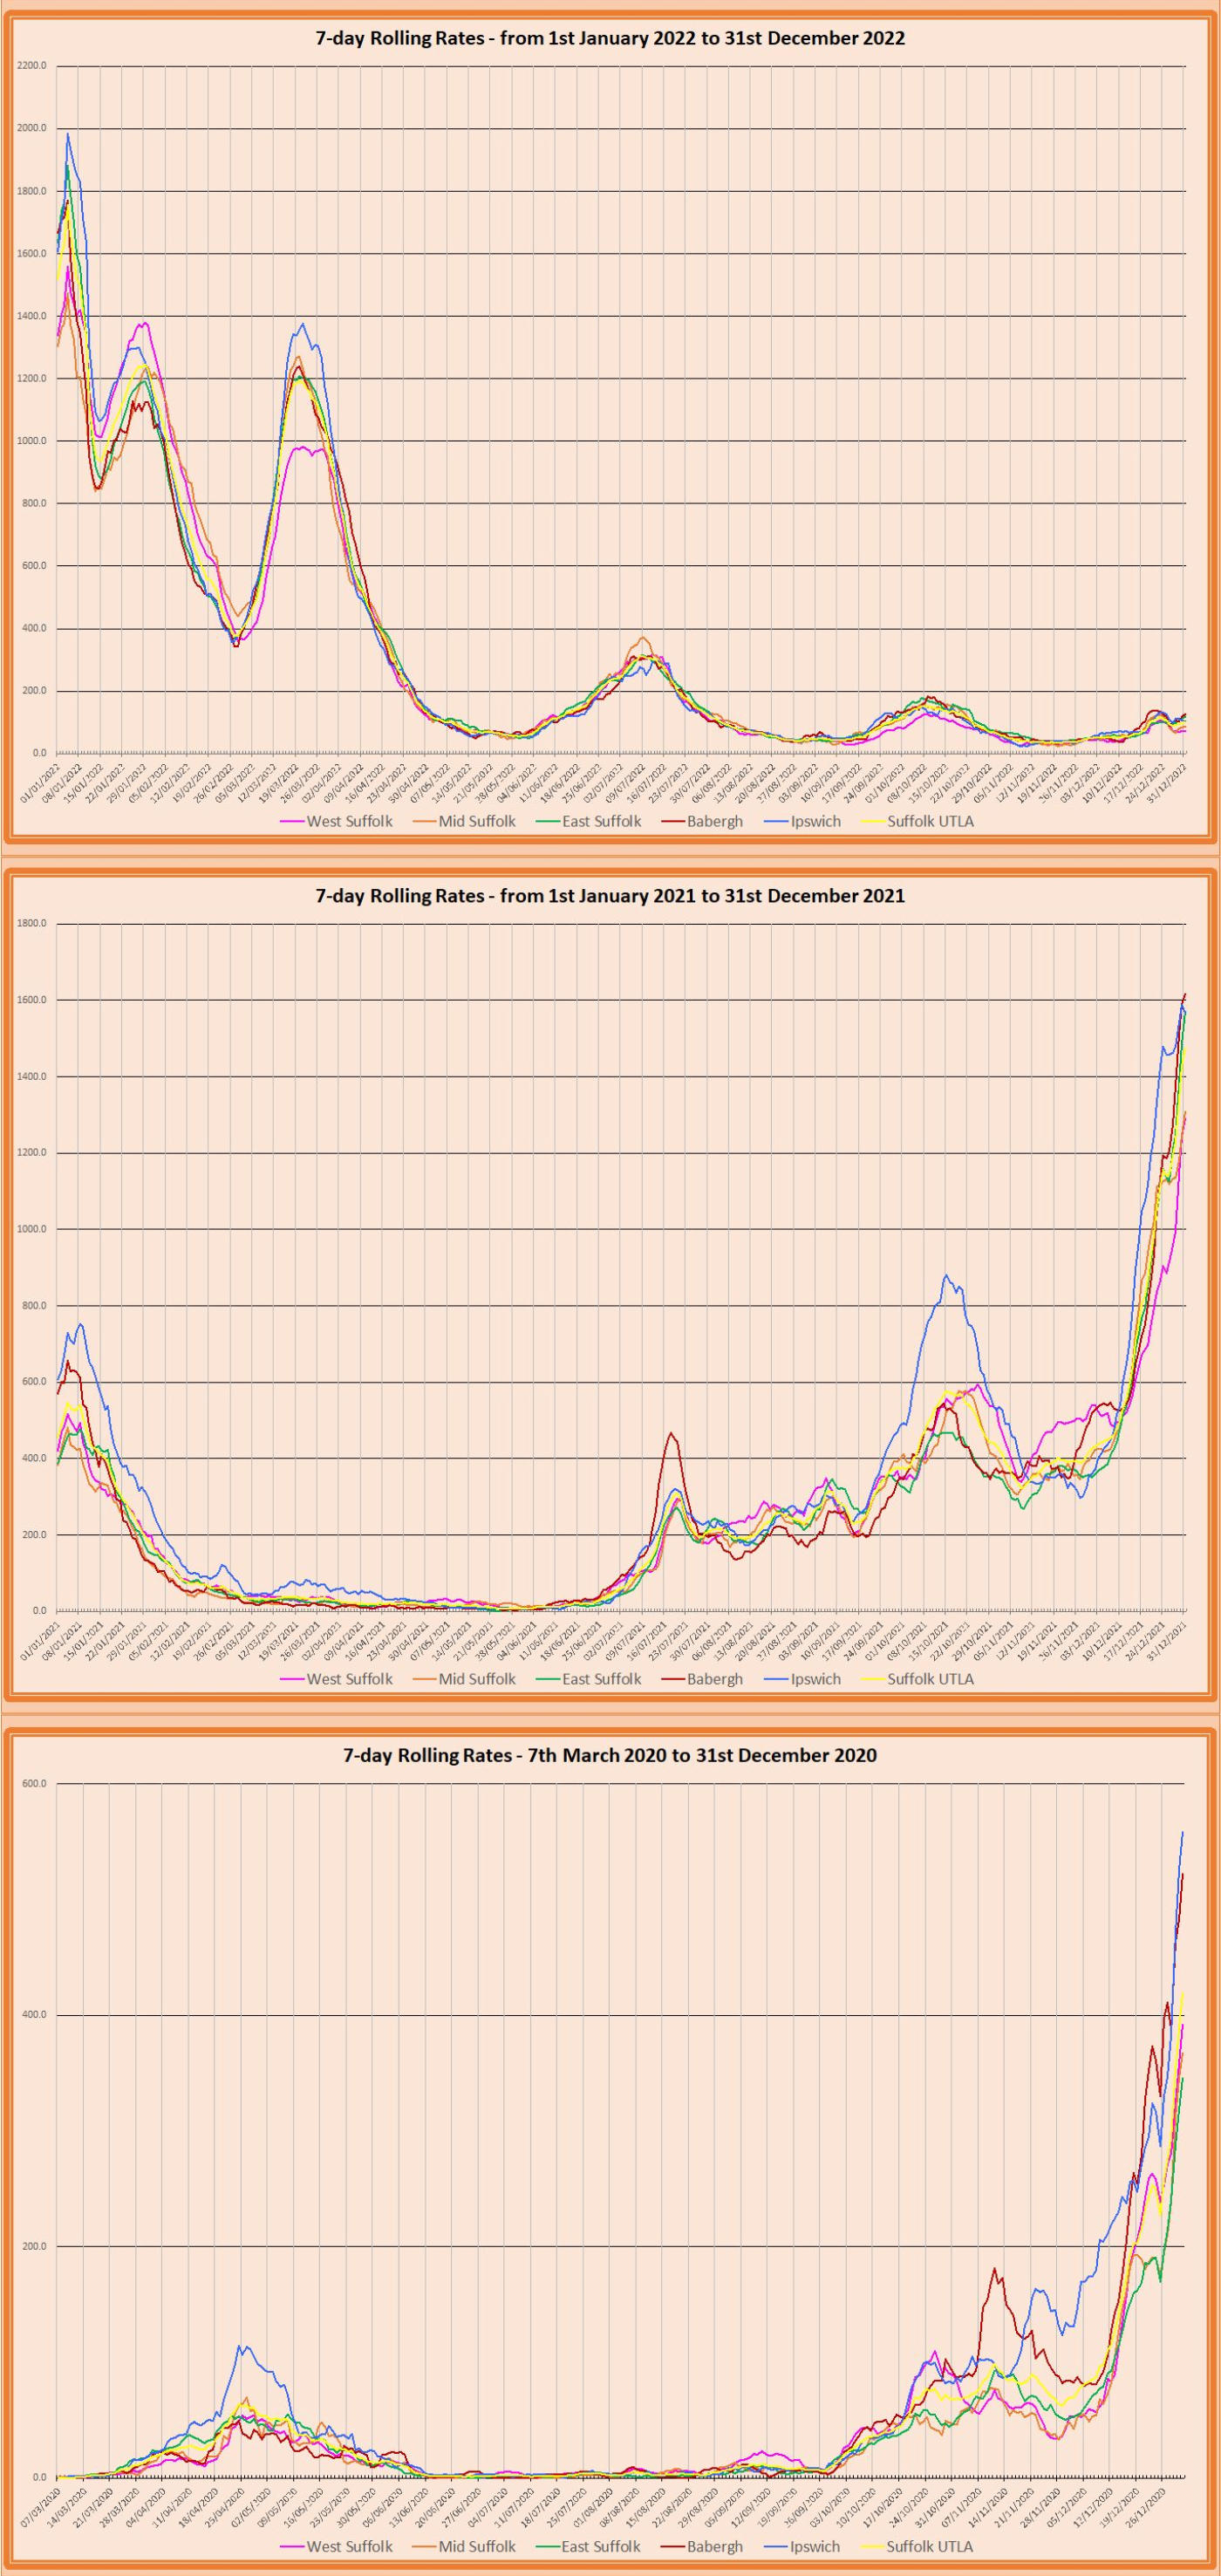
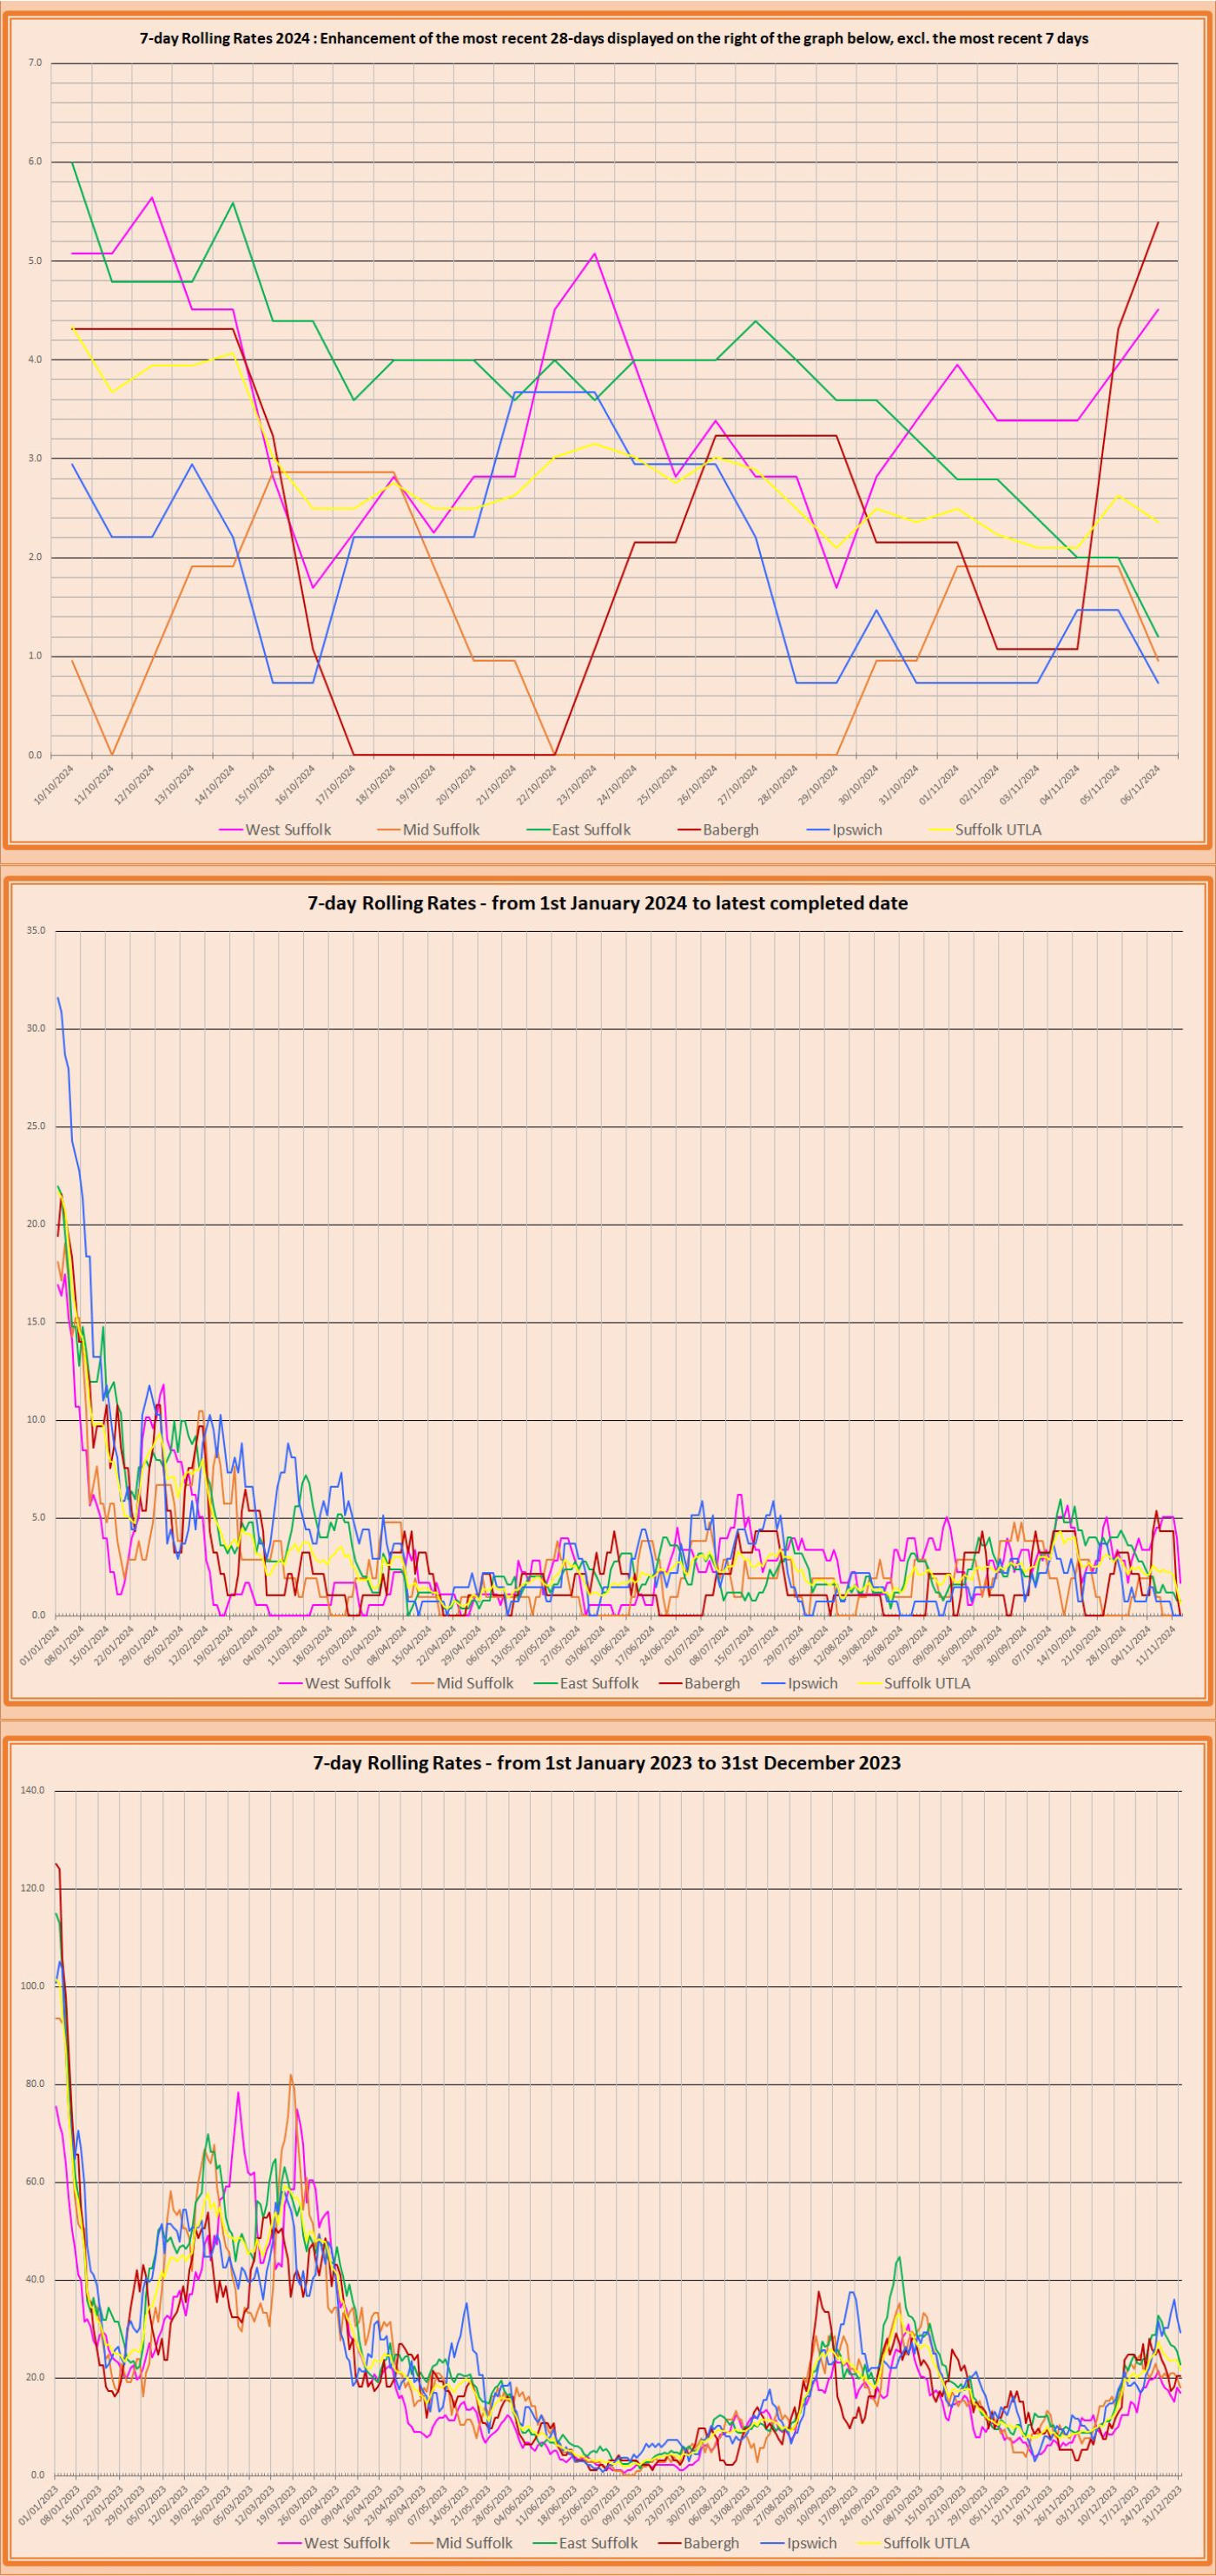
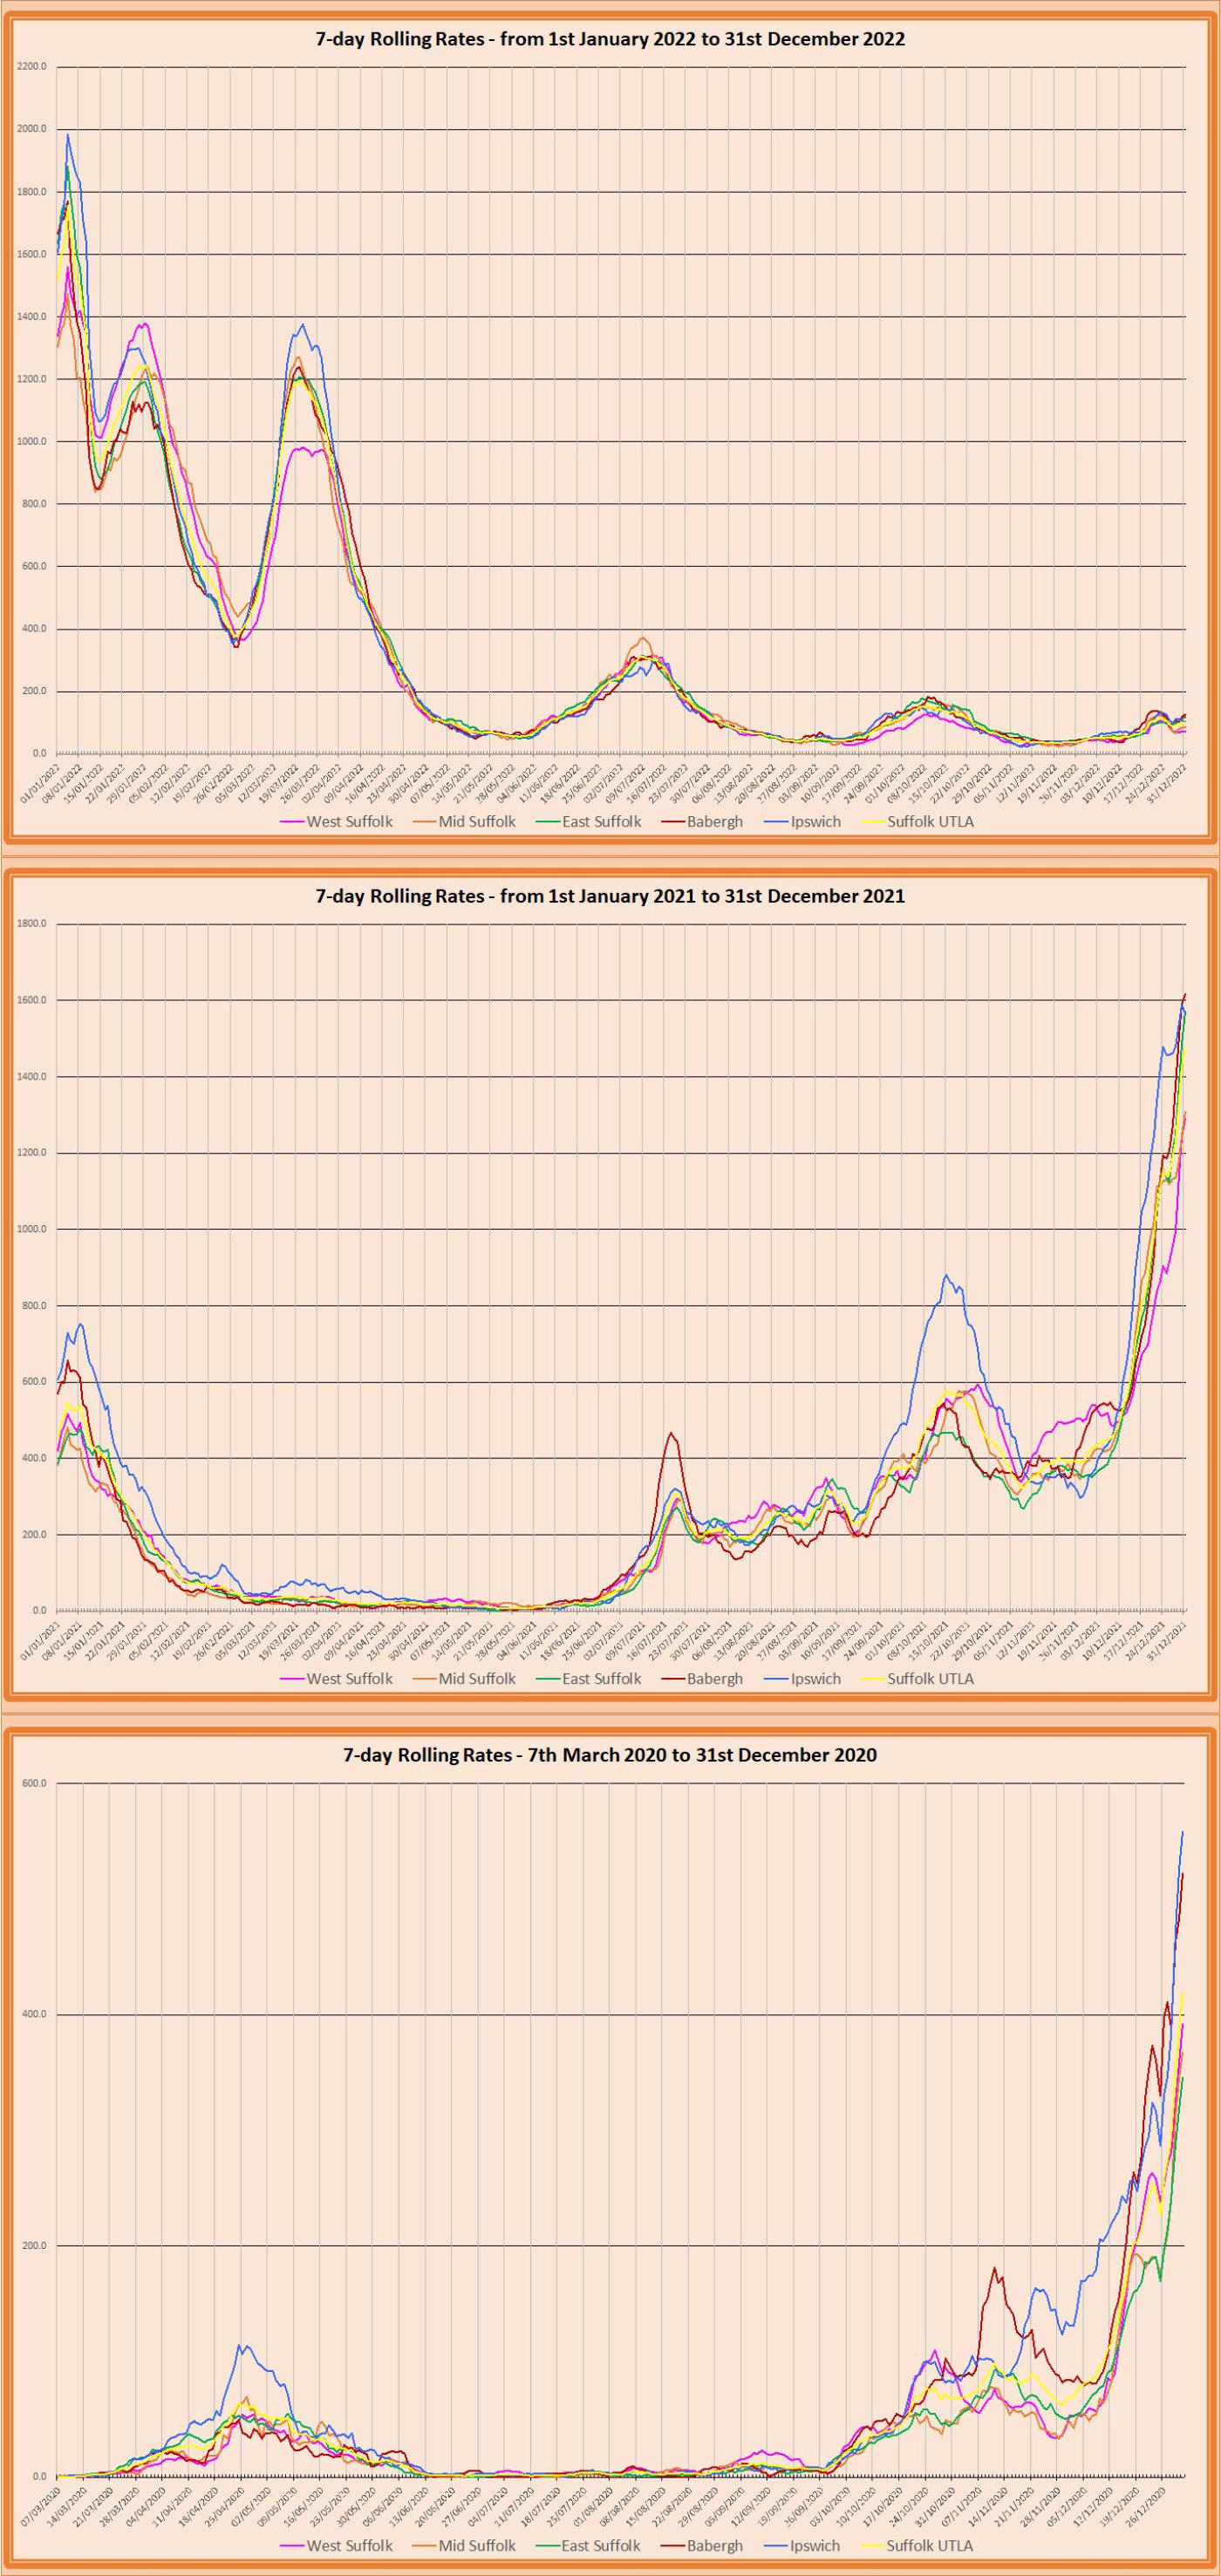
The chart and graphs below shows all the daily cases in Suffolk’s five Lower Tier Local Authority areas along with the combined figures as the Suffolk Upper Tier Local Authority area for the most recent 35 days up to the date prior to the reporting date. The six small graphs immediately below the chart show the 7-day rolling rates for these aeas for the most recent 28 days up to five days prior to the reporting date as indicated on the Home Page. The larger graphs below show the 7-day rolling rates for the periods indicated on them, from the first case in March 2020. (Note: the graphs are not all to the same scale) The complete chart and the graphs can be viewed in an Excel workbook as a ‘read-only’ document which can be accessed from the ‘LINKS’ page.
Contains MSOA names © Open Parliament copyright and database right 2020.
Contains Public Health England data © Crown Copyright and databases right 2020 .
Office for National Statistics licensed under the Open Government Licence v.3.0
Disclaimer: Whilst every effort has been made to ensure the data published on these pages is accurate,
I cannot accept responsibility for any inaccuracies in the data used to compile the graphs and charts.
© 2020 - 2024


SUFFOLK (UTLA)
Combined Chart & Graphs showing
cases for all five LTLA’s and the
combined figure as Suffolk UTLA
The chart and graphs below shows all the daily cases in Suffolk’s five Lower Tier Local Authority areas along with the combined figures as the Suffolk Upper Tier Local Authority area for the most recent 35 days up to the date prior to the reporting date. The six small graphs immediately below the chart show the 7-day rolling rates for these aeas for the most recent 28 days up to five days prior to the reporting date as indicated on the Home Page. The larger graphs below show the 7-day rolling rates for the periods indicated on them, from the first case in March 2020. (Note: the graphs are not all to the same scale) The complete chart and the graphs can be viewed in an Excel workbook as a ‘read-only’ document which can be accessed from the ‘LINKS’ page.
Covid-19
in East Suffolk
Contains MSOA names © Open Parliament copyright and database right 2020.
Contains Public Health England data © Crown Copyright and databases right 2020 .
Office for National Statistics licensed under the Open Government Licence v.3.0
Disclaimer: Whilst every effort has been made to ensure the data published on these
pages is accurate, I cannot accept responsibility for any inaccuracies in the data used
to compile the graphs and charts.
© 2020 - 2024