


Covid-19 in East Suffolk
MSOA’s
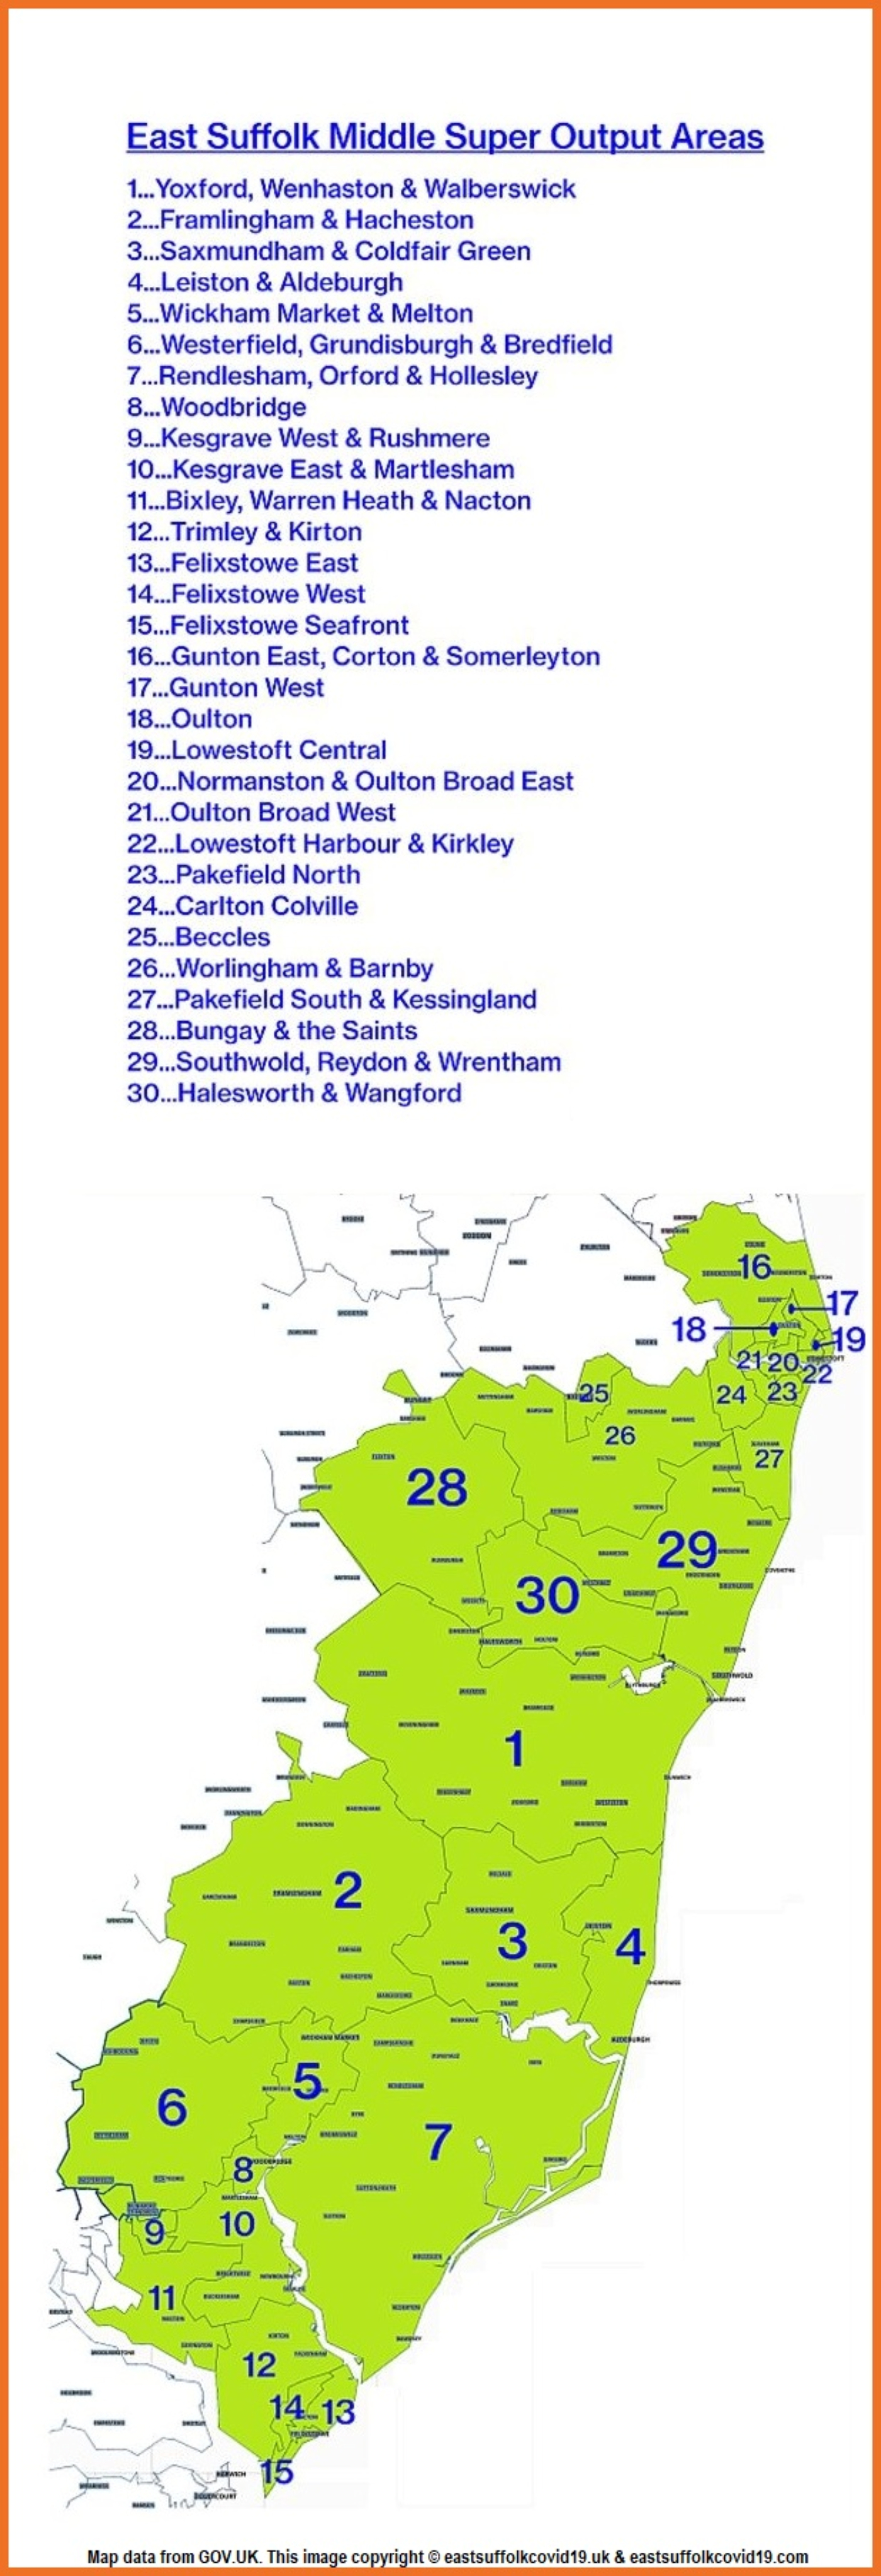
Middle Super Output Area cases.
East Suffolk, which has a population of around 250,000 is divided into 30 smaller areas known as ‘Middle Super Output Areas’ or MSOA’s. Each area has a population averaging some 8,000 but these range from just under 6,000 to over 13,000. The population of each of these areas is shown on the second chart on this page and these are figures determined by the Office for National Statistics (ONS) in their 2020 population estimate. Below is a map which shows the location of all 30 MSOA’s in East Suffolk In the first chart, which gives a comparison of the two most recent weeks’ cases, the areas are colour coded. The first fifteen are coloured in shades of yellow and these make up what was once the ‘Suffolk Coastal’ area, whilst the second fifteen which are coloured in shades of orange made up the original ‘Waveney’ area. The second chart displays all figures for the most recent EIGHT weeks. Links to the Excel workbooks for both of these charts, which can be opened as ‘read- only’ documents in a browser, are on the ‘LINKS’ page, and these contain historical data.
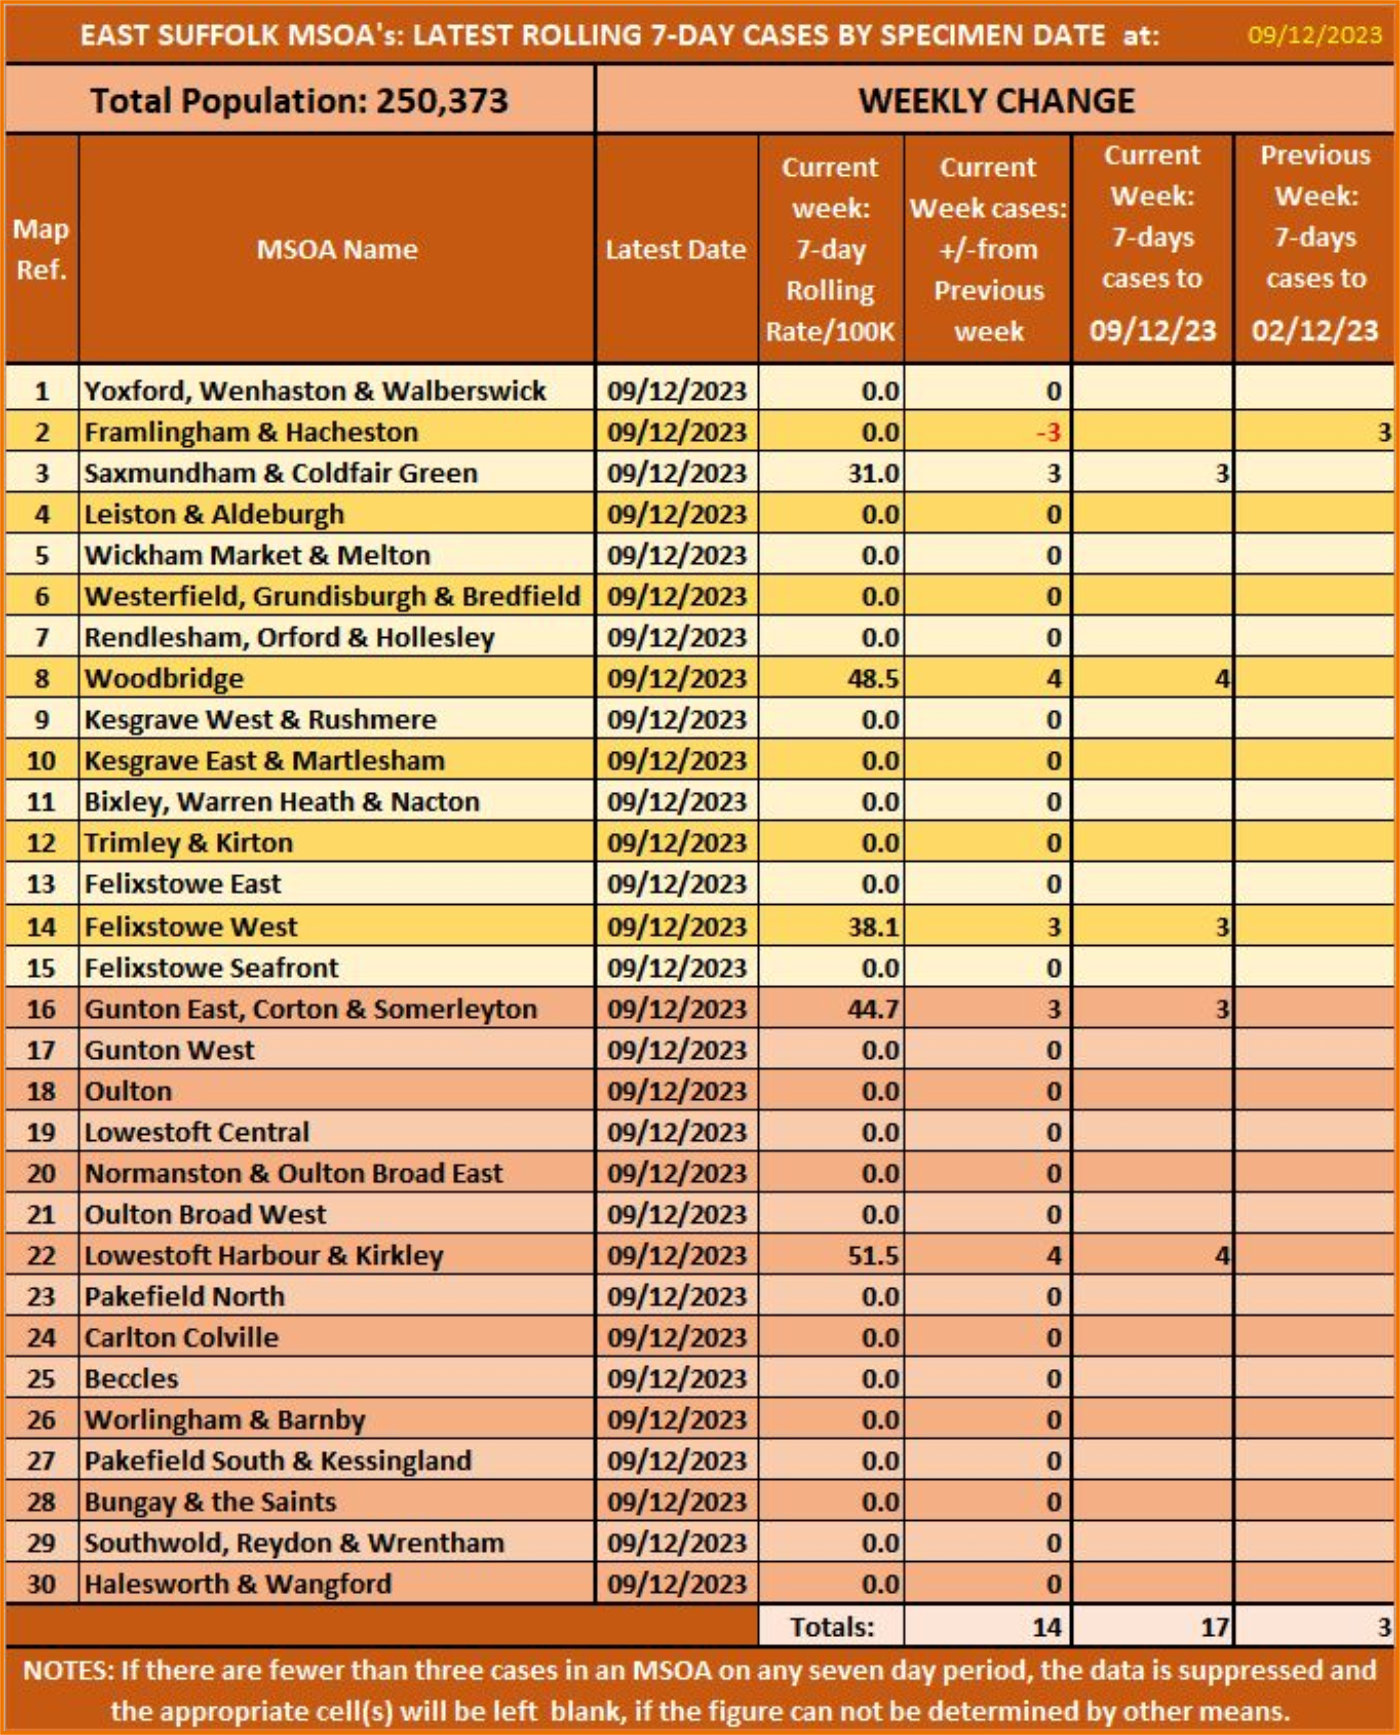
Most recent two-week comparison
This chart displays the most recent TWO weeks for each of the 30 MSOA’s, and indicates the change in the number of cases reported between the two. Also shown is the case rate per 100,000 of population for the most recent figure in each area. Please also see the note at the foot of the chart.Most recent EIGHT weeks’ cases
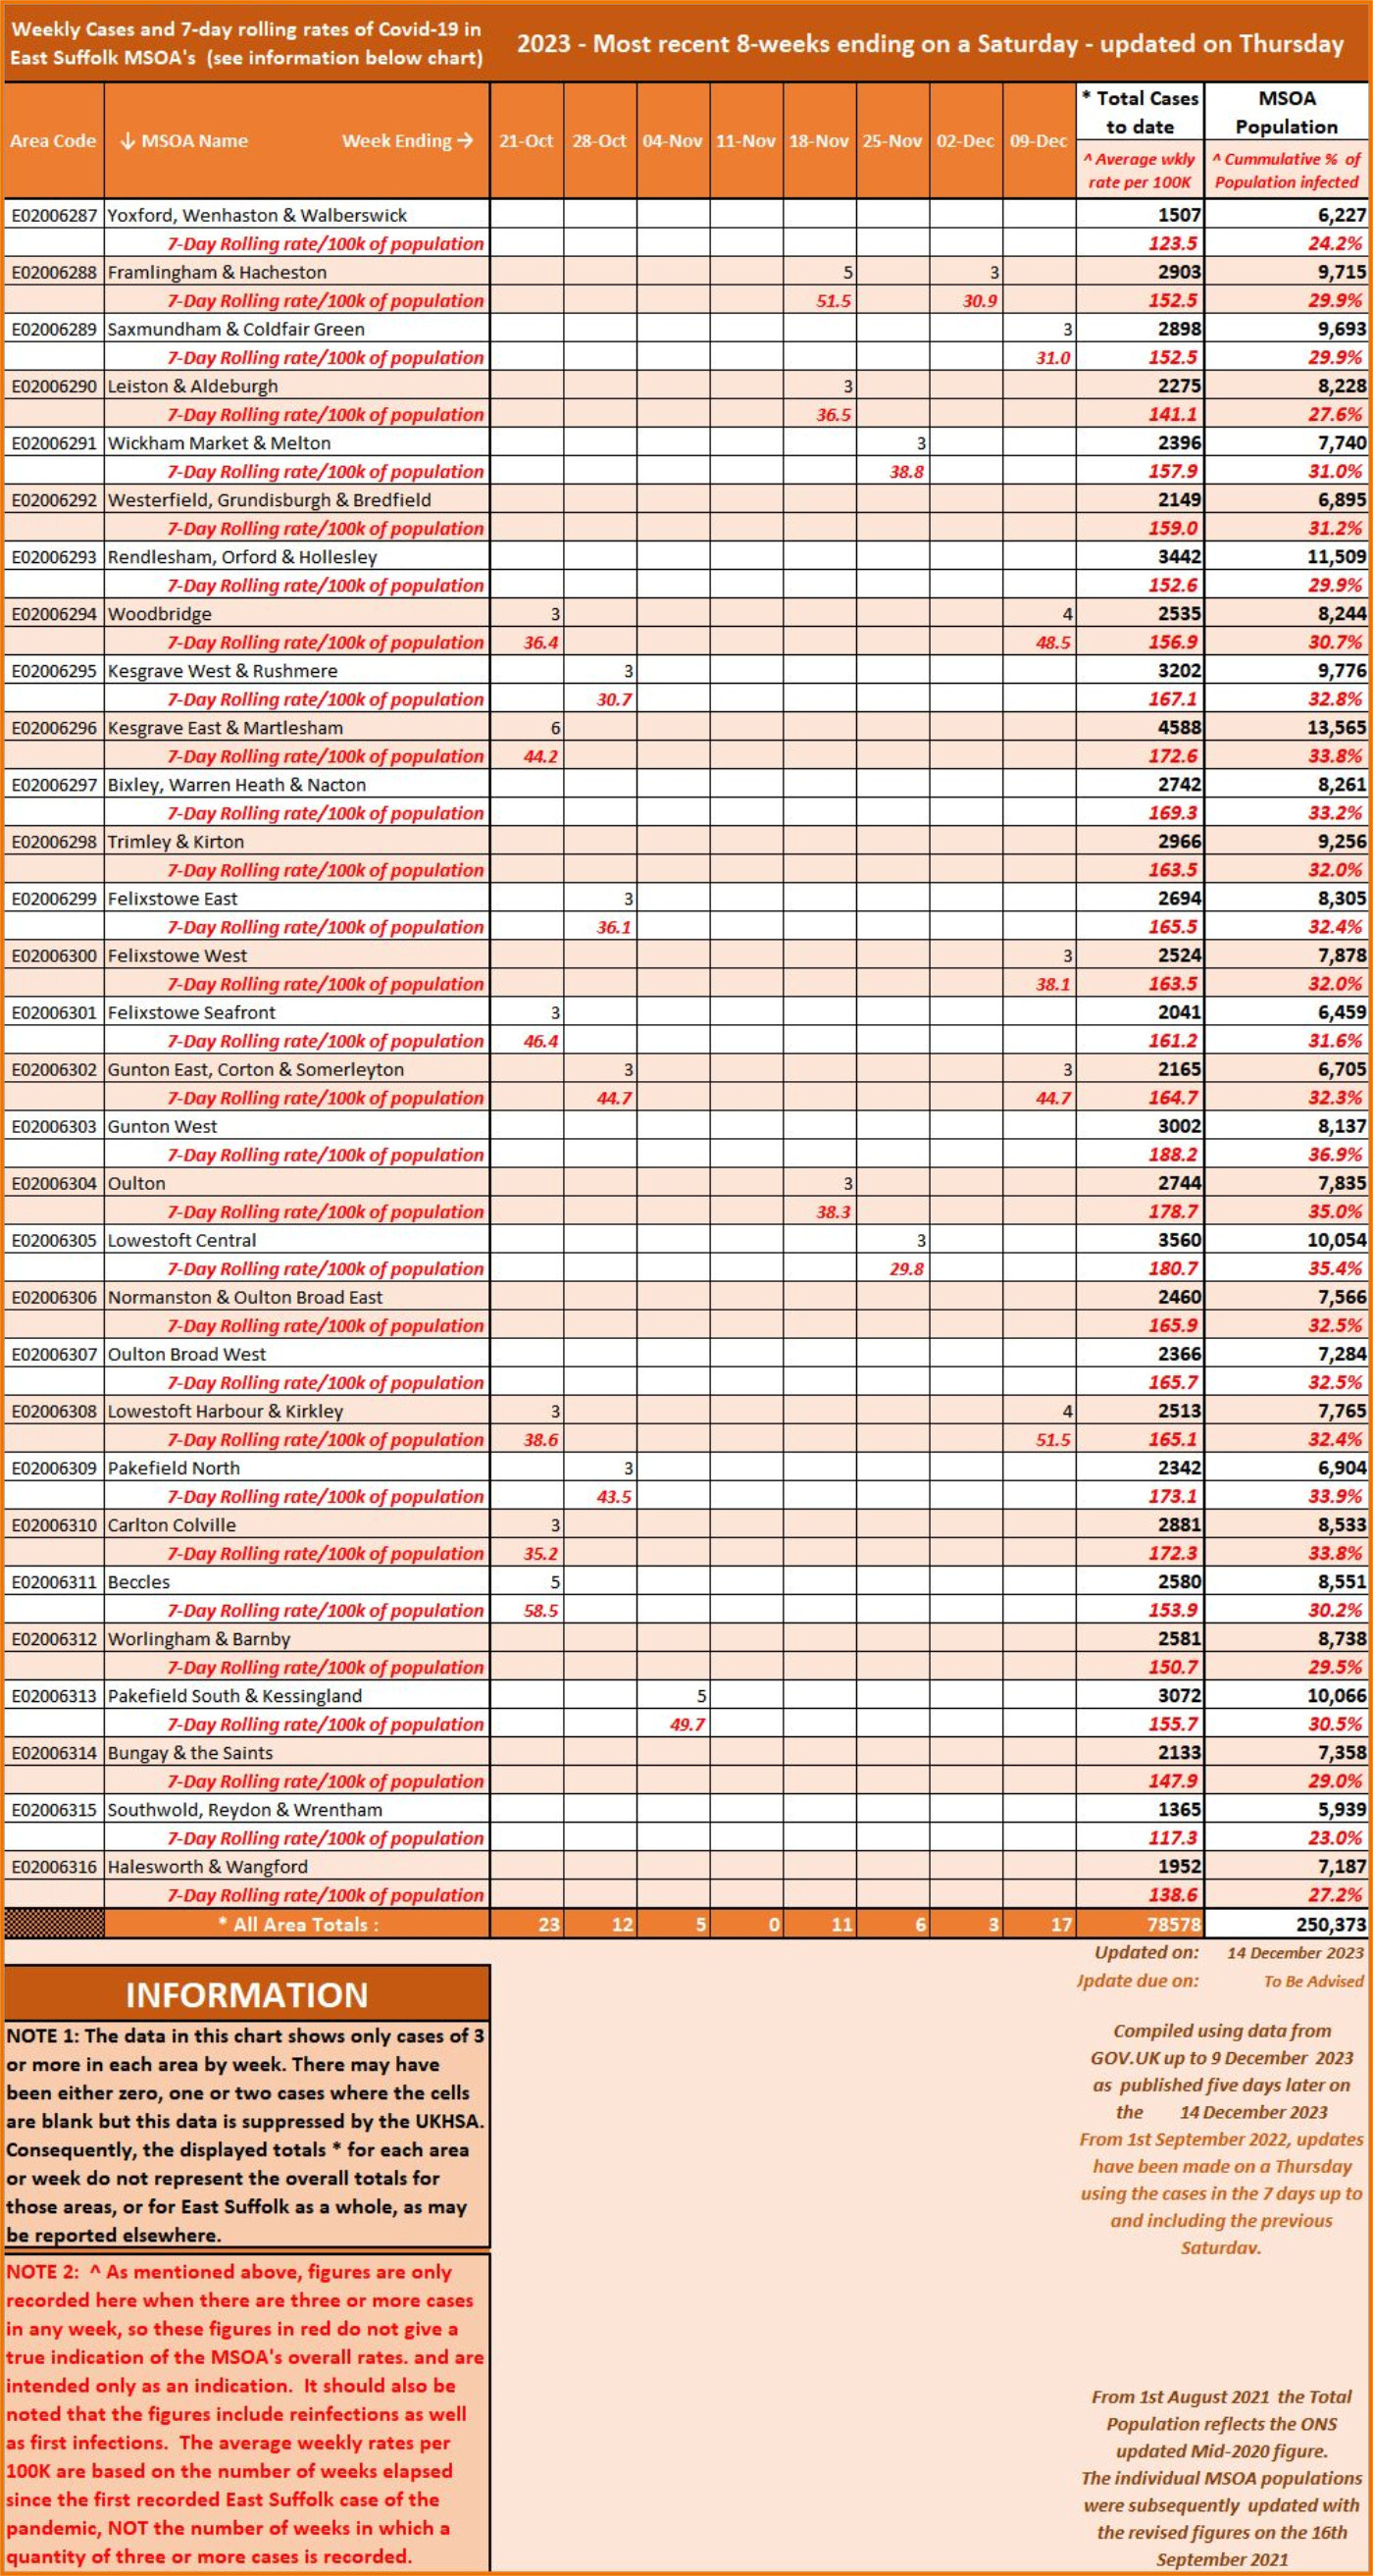
The following chart shows the weekly cases and rates in each of the 30 MSOA’s for the most recent EIGHT weeks


Contains MSOA names © Open Parliament copyright and database right 2020.
Contains Public Health England data © Crown Copyright and databases right 2020 .
Office for National Statistics licensed under the Open Government Licence v.3.0
Disclaimer: Whilst every effort has been made to ensure the data published on these pages is accurate,
I cannot accept responsibility for any inaccuracies in the data used to compile the graphs and charts.
© 2020 - 2024


The updating of the charts/graphs on this page has now ceased as the data for them is no longer available.


MSOA’s
Middle Super Output Area cases.
East Suffolk, which has a population of around 250,000 is divided into 30 smaller areas known as ‘Middle Super Output Areas’ or MSOA’s. Each area has a population averaging some 8,000 but these range from just under 6,000 to over 13,000. The population of each of these areas is shown on the second chart on this page and these are figures determined by the Office for National Statistics (ONS) in their 2020 population estimate. Below is a map which shows the location of all 30 MSOA’s in East Suffolk In the first chart, which gives a comparison of the two most recent weeks’ cases, the areas are colour coded. The first fifteen are coloured in shades of yellow and these make up what was once the ‘Suffolk Coastal’ area, whilst the second fifteen which are coloured in shades of orange made up the original ‘Waveney’ area. The second chart displays all figures for the most recent EIGHT weeks. Links to the Excel workbooks for both of these charts, which can be opened as ‘read-only’ documents in a browser, are on the ‘LINKS’ page, and these contain historical data.


Most recent two-week comparison
This chart displays the most recent TWO weeks for each of the 30 MSOA’s, and indicates the change in the number of cases reported between the two. Also shown is the case rate per 100,000 of population for the most recent figure in each area. Please also see the note at the foot of the chart.Most recent EIGHT weeks’ cases
The following chart shows the weekly cases and rates in each of the 30 MSOA’s for the most recent EIGHT weeks

Covid-19
in East Suffolk
Contains MSOA names © Open Parliament copyright and database right 2020.
Contains Public Health England data © Crown Copyright and databases right 2020 .
Office for National Statistics licensed under the Open Government Licence v.3.0
Disclaimer: Whilst every effort has been made to ensure the data published on these
pages is accurate, I cannot accept responsibility for any inaccuracies in the data used
to compile the graphs and charts.
© 2020 - 2024

The updating of the charts/graphs on this page has
now ceased as the data for them is no longer available.