


Covid-19 in East Suffolk
DAILY CASES & RATES
About the Chart and Graphs
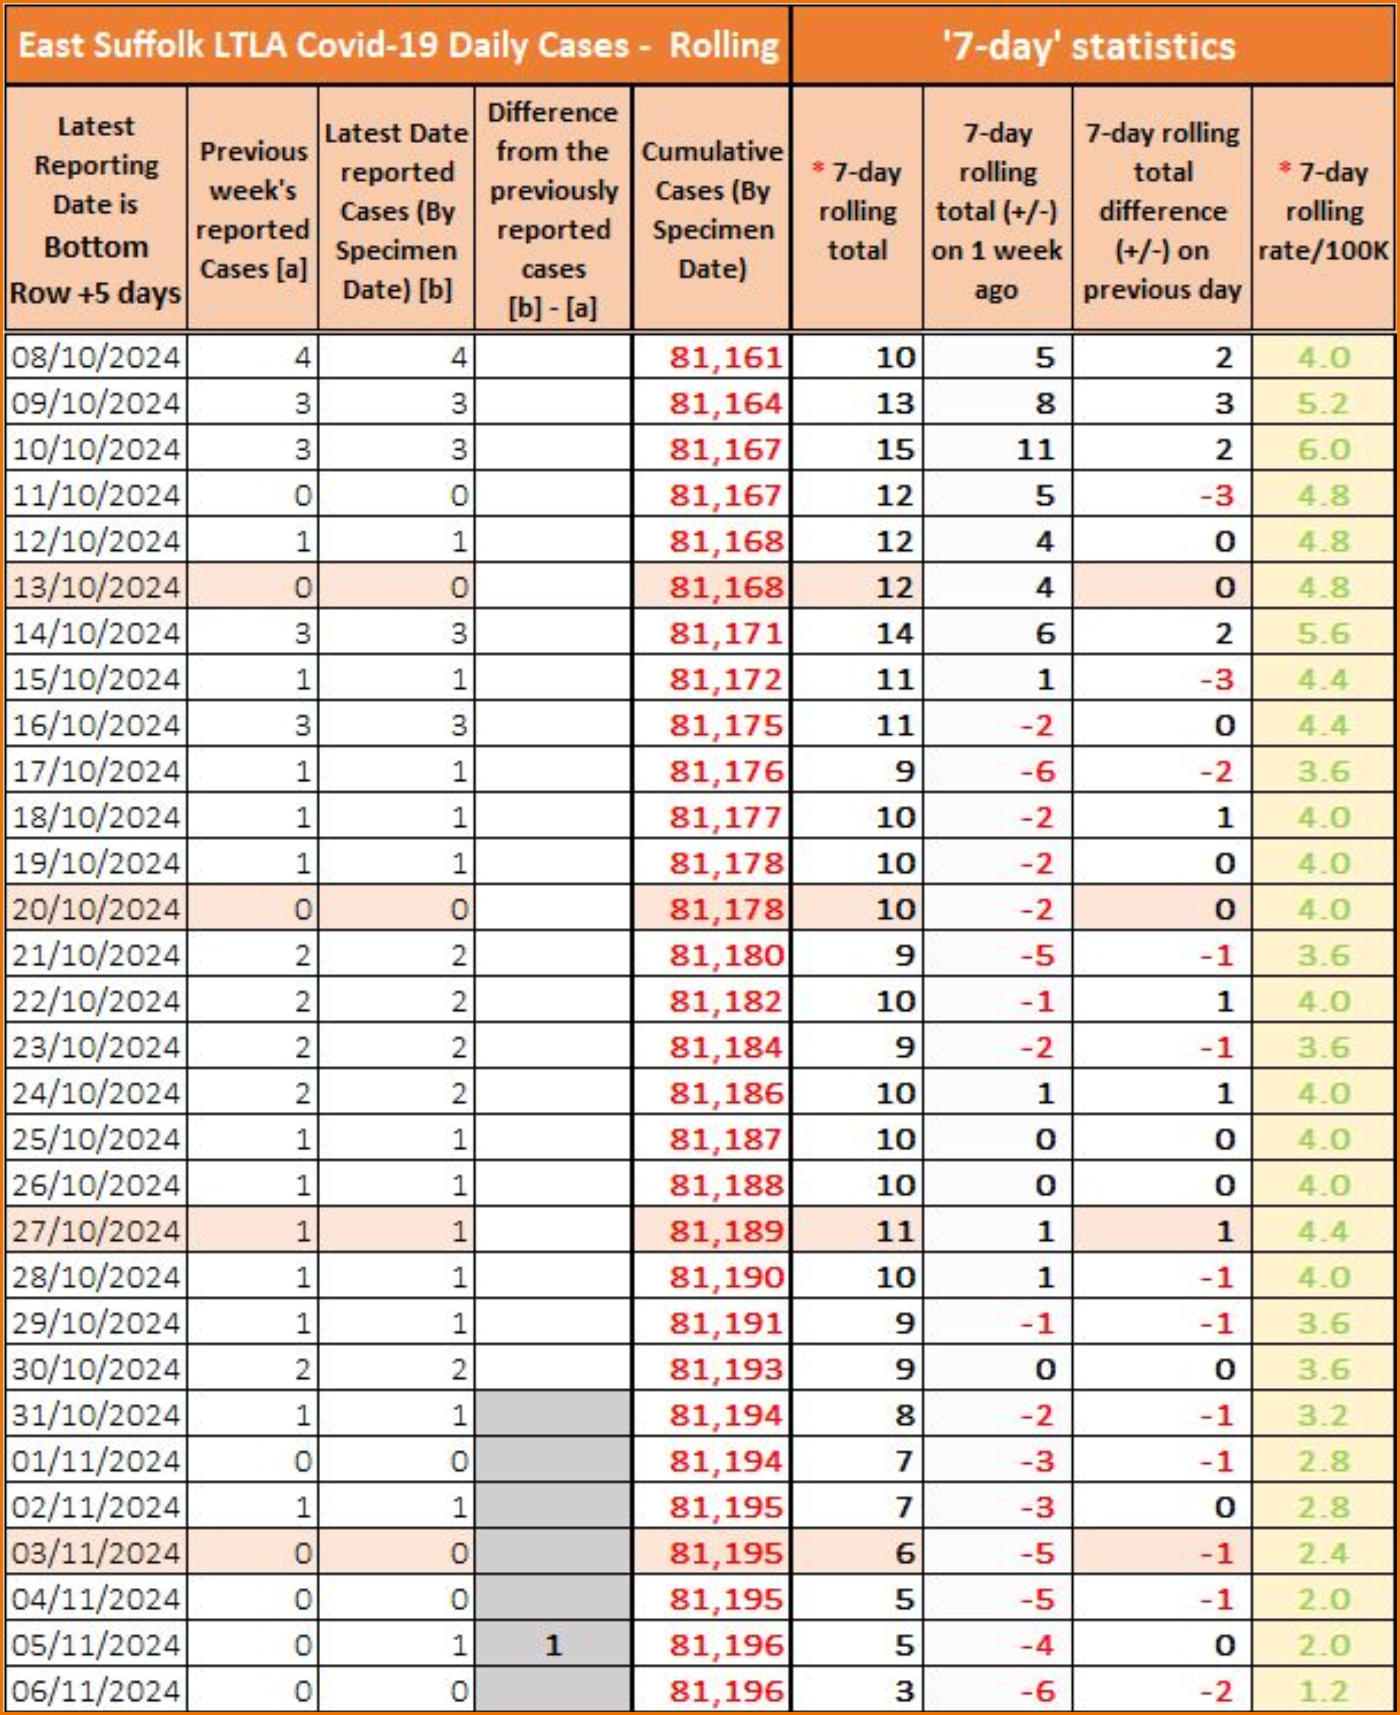
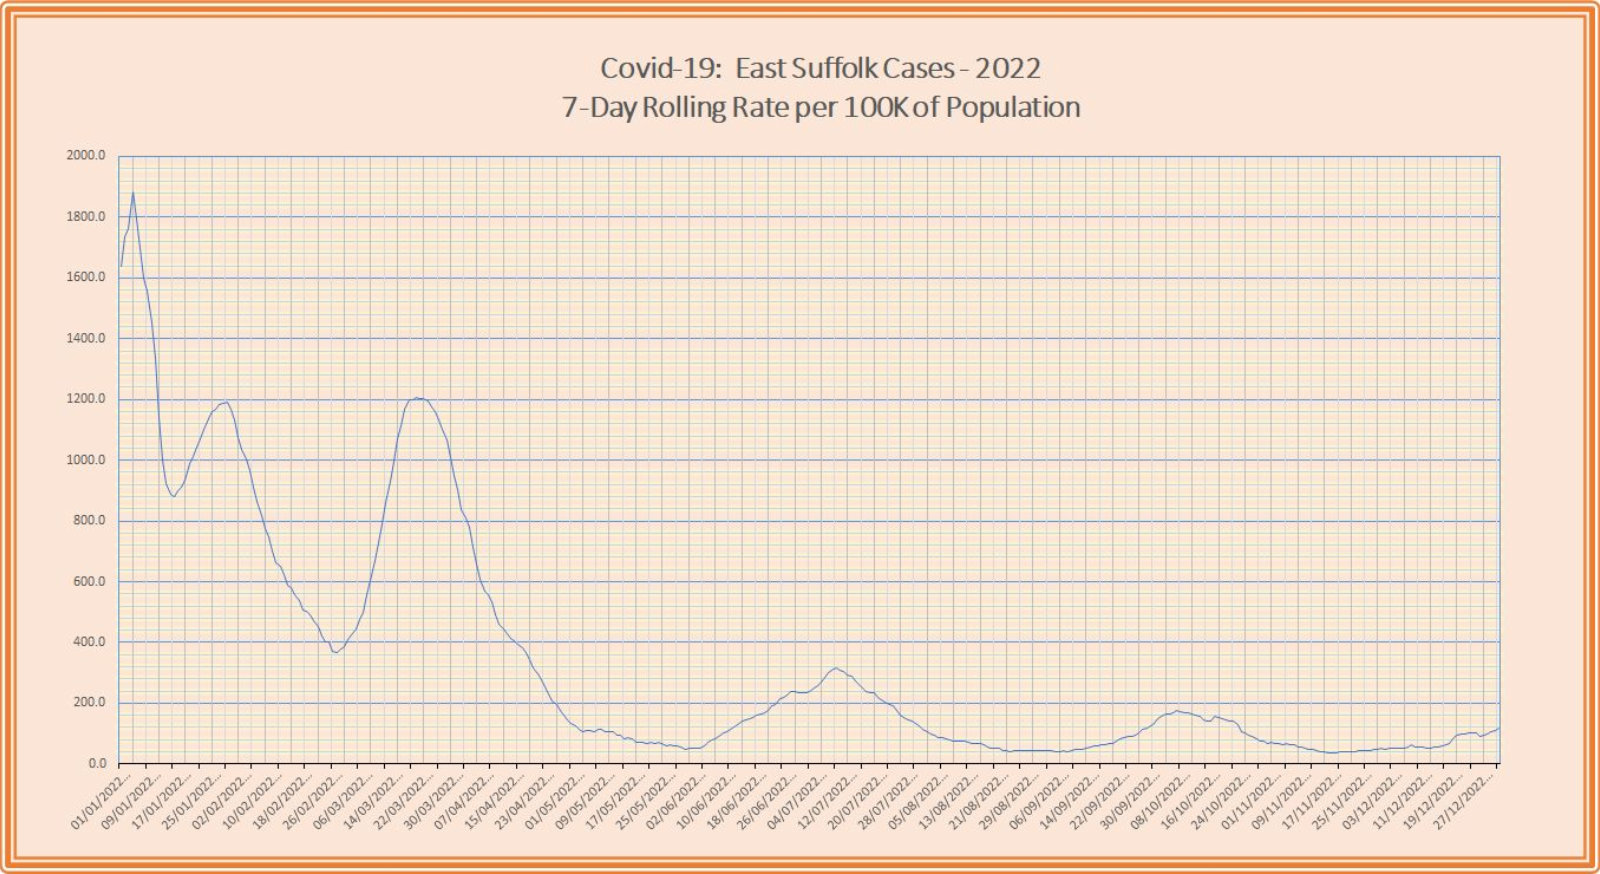
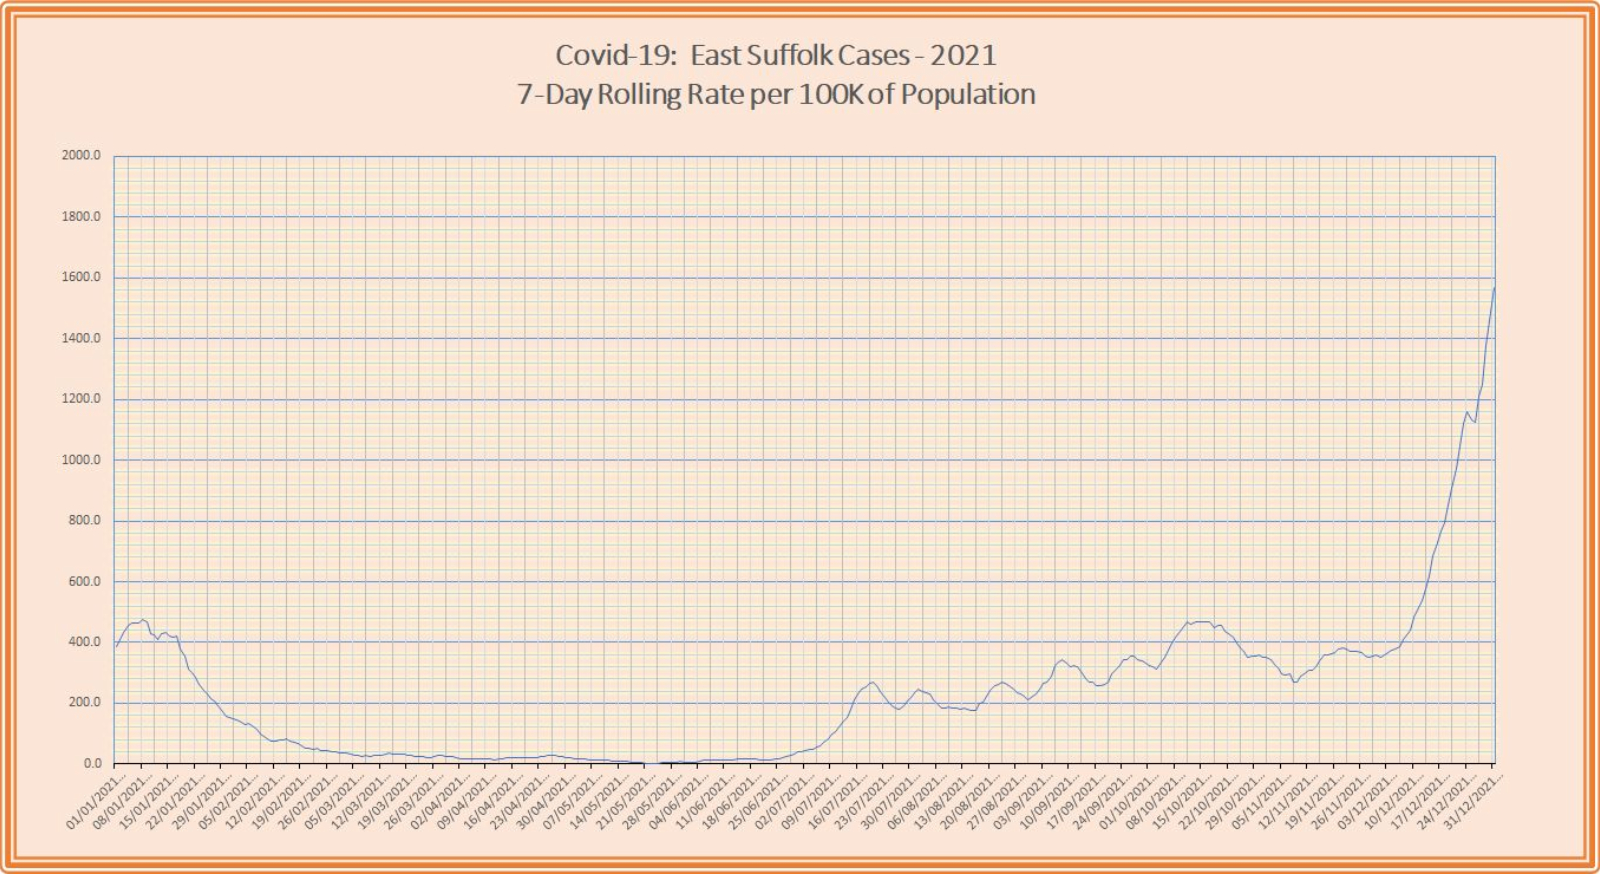
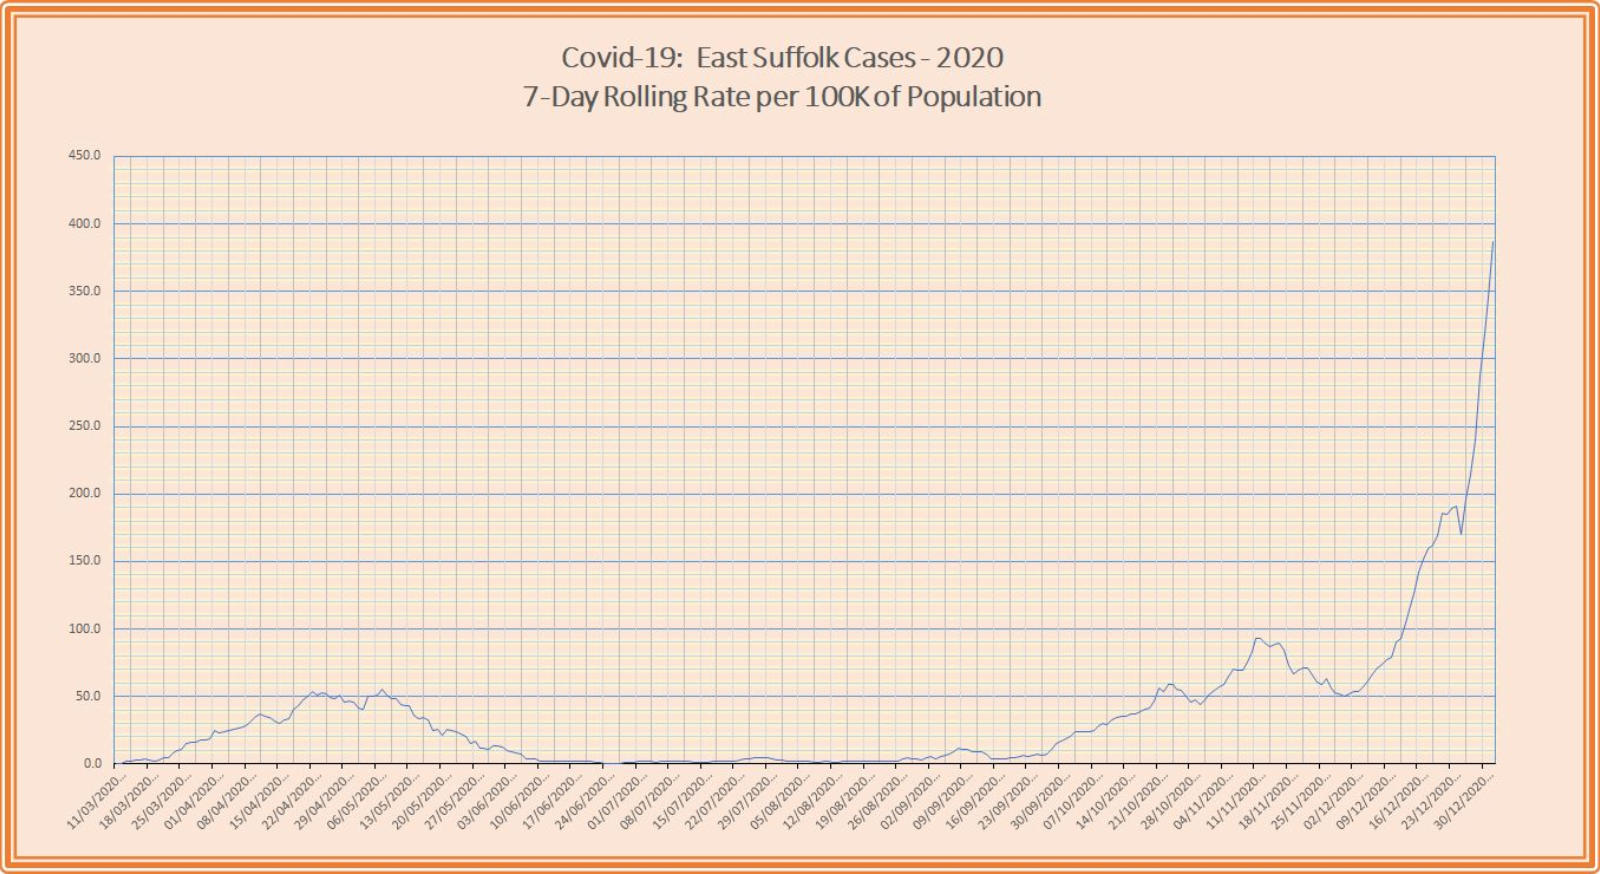
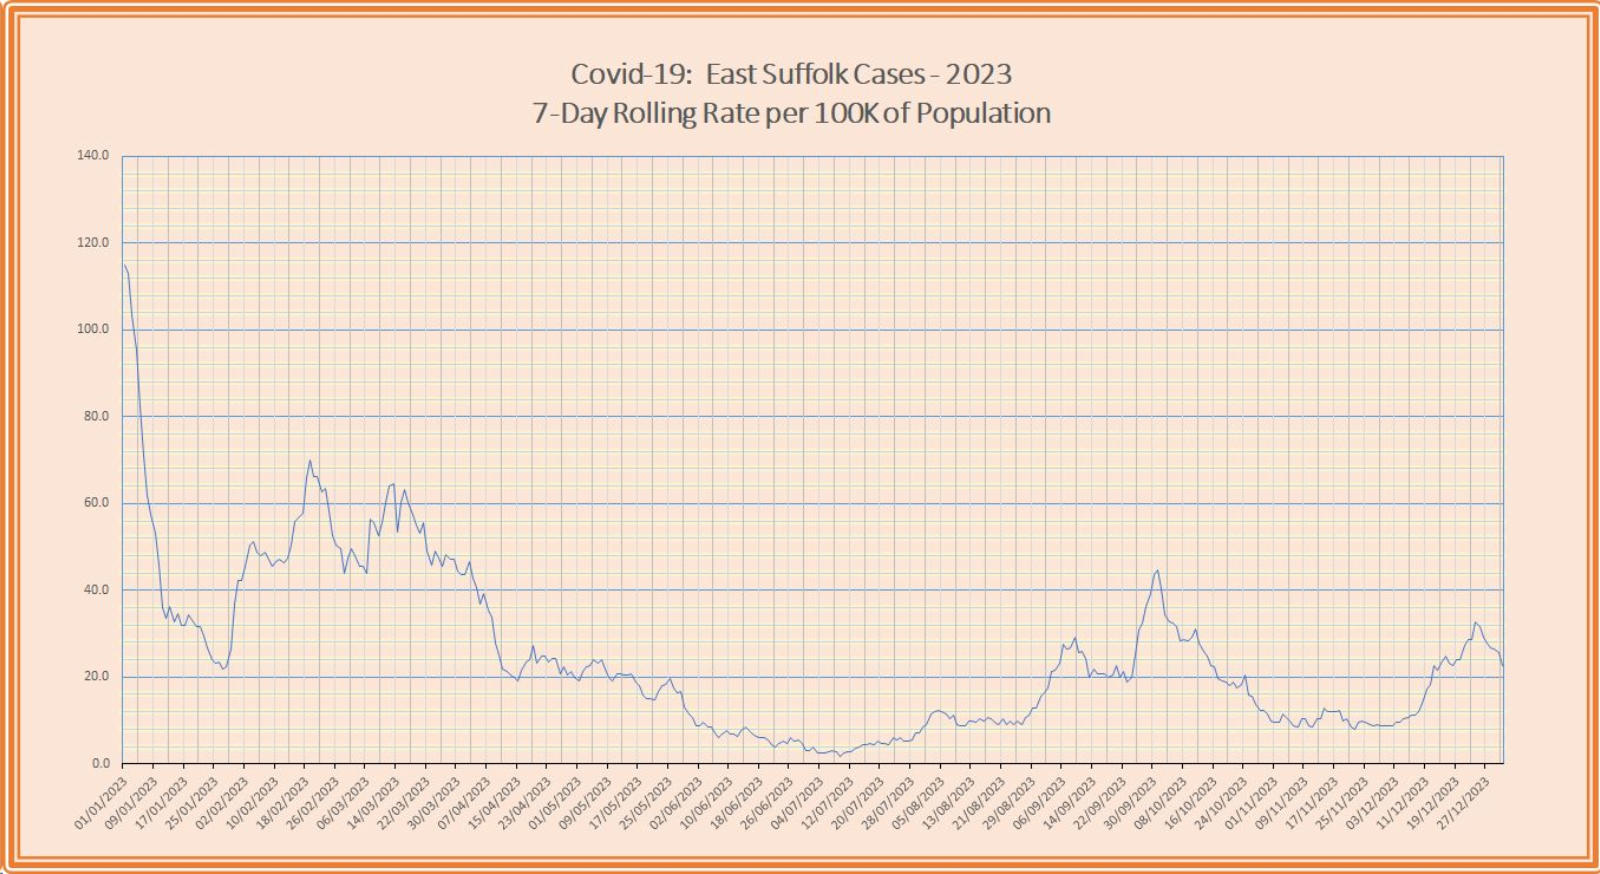
The chart on this page displays the most recent 30 days of data for East Suffolk used in the first graph below. The data comprises the daily cases so far reported for those days, along with the rolling seven-day totals and the rolling seven-day case rates. Also shown are the daily cumulative total cases reported since the start of the pandemic. The five graphs below (not all to the same scale) plot the seven-day rolling rates since the start of the pandemic as follows: Graph 1: The year 2024 to date. Graph 2: The full year 2023 Graph 3: The full year 2022. Graph 4: The full year 2021. Graph 5: The year 2020 from when the first case was reported in East Suffolk. A link to the Microsoft Excel Workbook, which can be viewed in a browser window as a ‘read-only’ document, from which the chart and graphs are taken, can be found on the ‘LINKS’ page in the navigation bar. The complete chart is also included in the link.
Contains MSOA names © Open Parliament copyright and database right 2020.
Contains Public Health England data © Crown Copyright and databases right 2020 .
Office for National Statistics licensed under the Open Government Licence v.3.0
Disclaimer: Whilst every effort has been made to ensure the data published on these pages is accurate,
I cannot accept responsibility for any inaccuracies in the data used to compile the graphs and charts.
© 2020 - 2024

Graph 1
Graph 2
Graph 3

Graph 4
Graph 5


DAILY CASES & RATES
About the Chart and Graphs
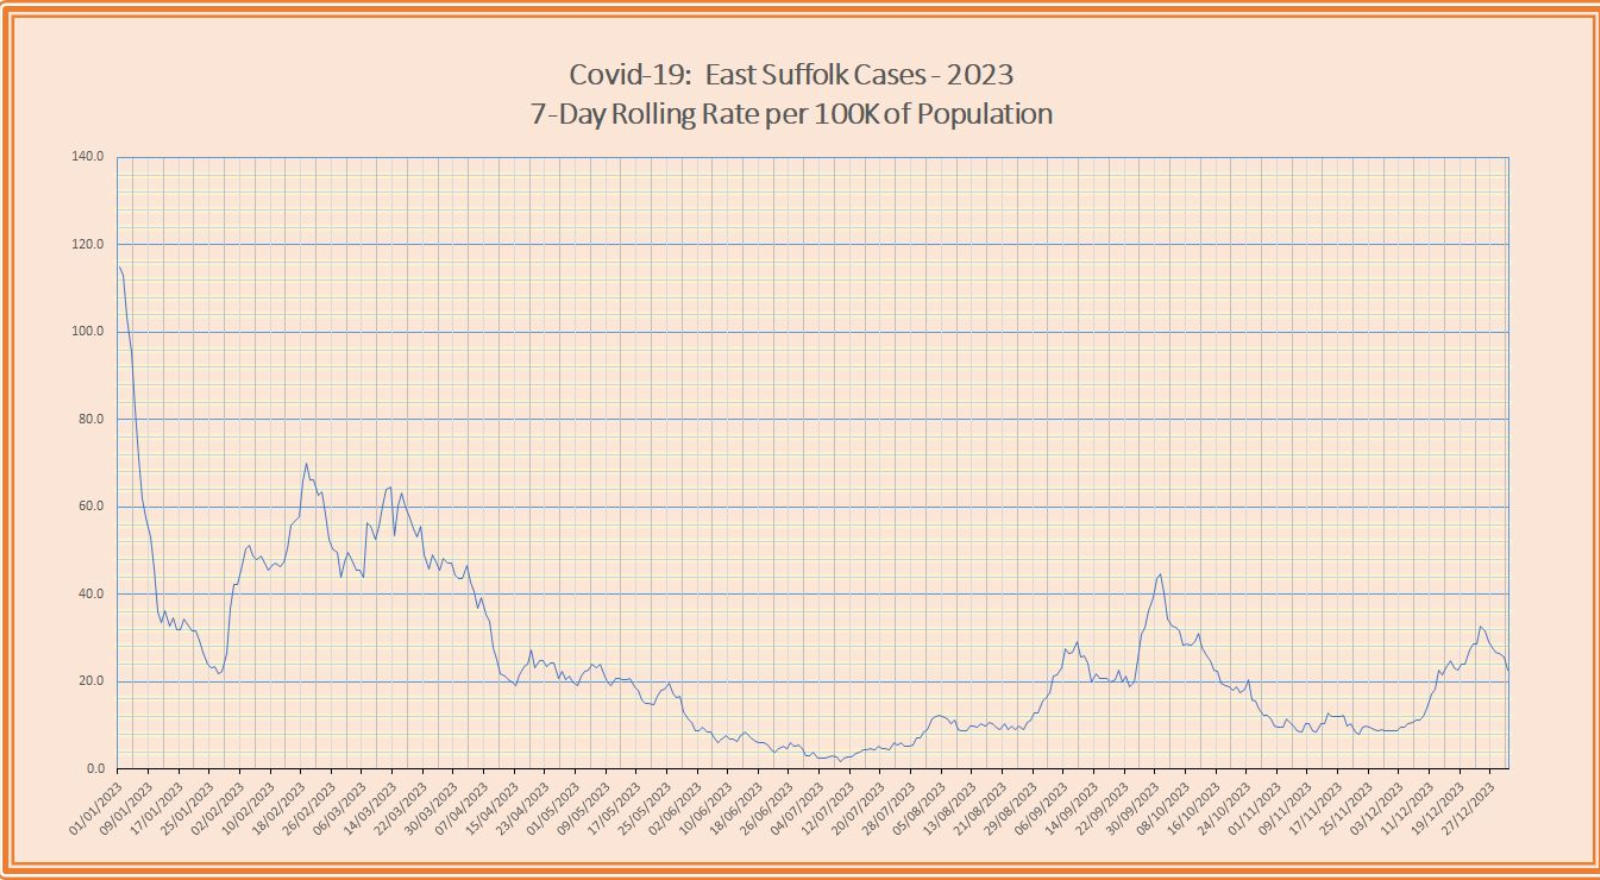
The chart on this page displays the most recent 30 days of data for East Suffolk used in the first graph below. The data comprises the daily cases so far reported for those days, along with the rolling seven-day totals and the rolling seven-day case rates. Also shown are the daily cumulative total cases reported since the start of the pandemic. The five graphs below (not all to the same scale) plot the seven-day rolling rates since the start of the pandemic as follows: Graph 1: The year 2024 to date. Graph 2: The full year 2023 Graph 3: The full year 2022. Graph 4: The full year 2021. Graph 5: The year 2020 from when the first case was reported in East Suffolk. A link to the Microsoft Excel Workbook, which can be viewed in a browser window as a ‘read-only’ document, from which the chart and graphs are taken, can be found on the ‘LINKS’ page in the navigation bar. The complete chart is also included in the link.

Covid-19
in East Suffolk
Contains MSOA names © Open Parliament copyright and database right 2020.
Contains Public Health England data © Crown Copyright and databases right 2020 .
Office for National Statistics licensed under the Open Government Licence v.3.0
Disclaimer: Whilst every effort has been made to ensure the data published on these
pages is accurate, I cannot accept responsibility for any inaccuracies in the data used
to compile the graphs and charts.
© 2020 - 2024

Graph 1
Graph 2
Graph 4

Graph 3

Graph 5