


Covid-19 in East Suffolk
CASES BY AGE GROUP
Charts and Graph of all cases.
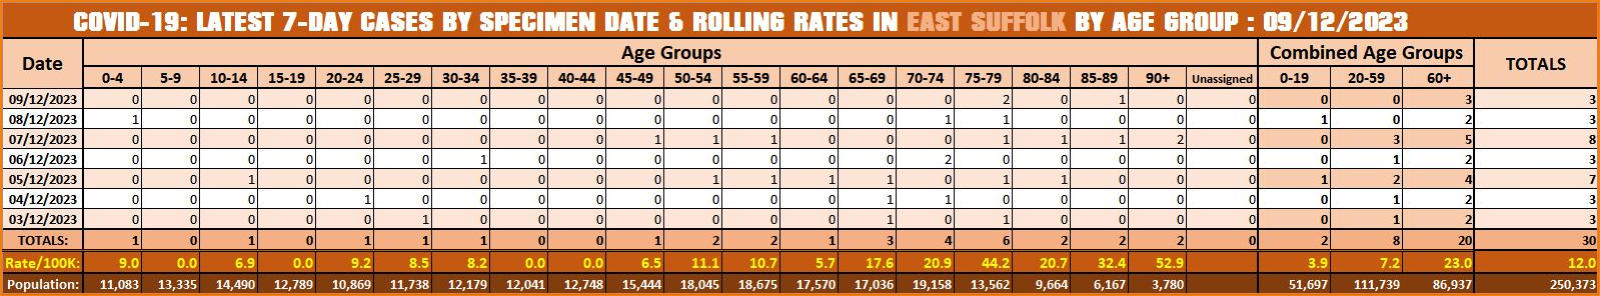
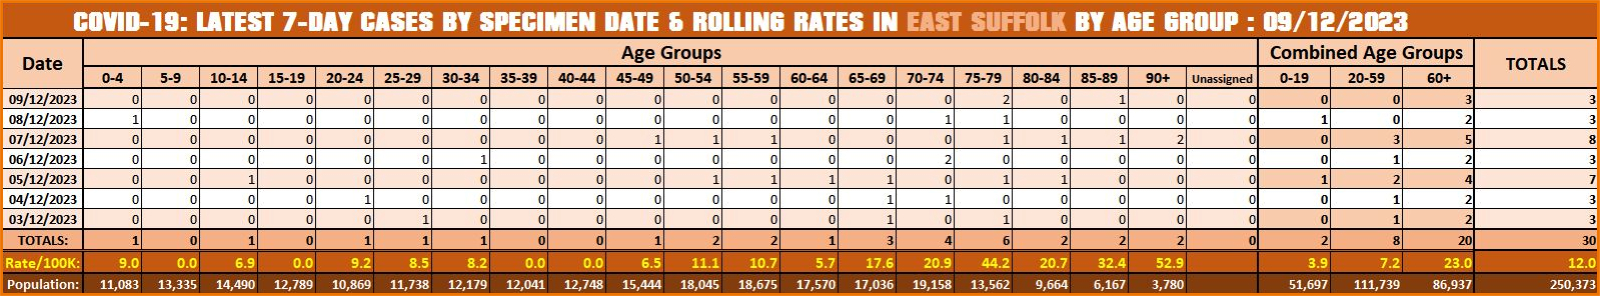
This following chart shows the latest seven days cases in five-year age groups along with the infection rate within each group.
Contains MSOA names © Open Parliament copyright and database right 2020.
Contains Public Health England data © Crown Copyright and databases right 2020 .
Office for National Statistics licensed under the Open Government Licence v.3.0
Disclaimer: Whilst every effort has been made to ensure the data published on these pages is accurate,
I cannot accept responsibility for any inaccuracies in the data used to compile the graphs and charts.
© 2020 - 2025

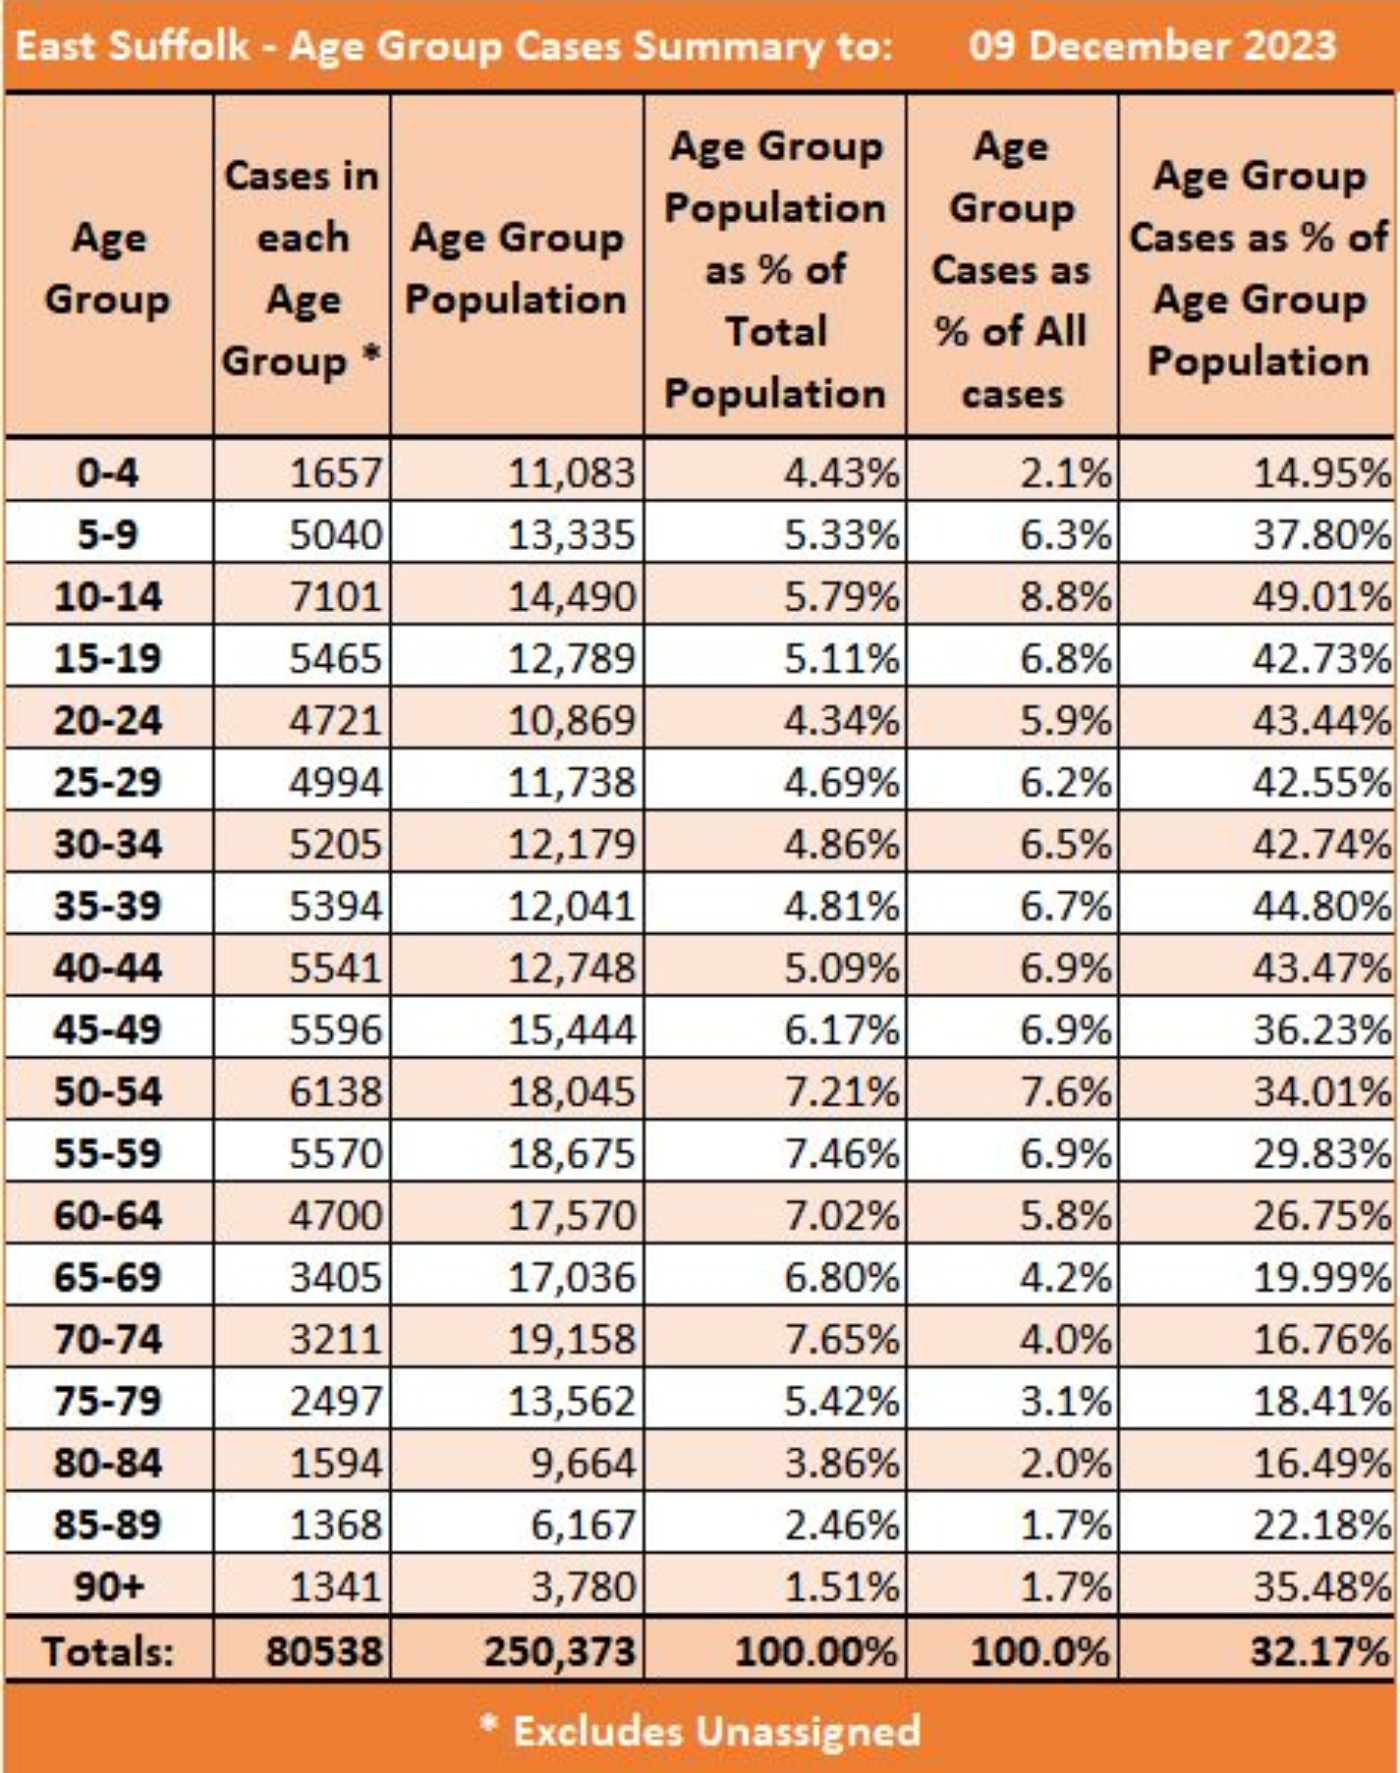
The following chart is a summary of all cases by age group and displays comparison statistics
between the groups.
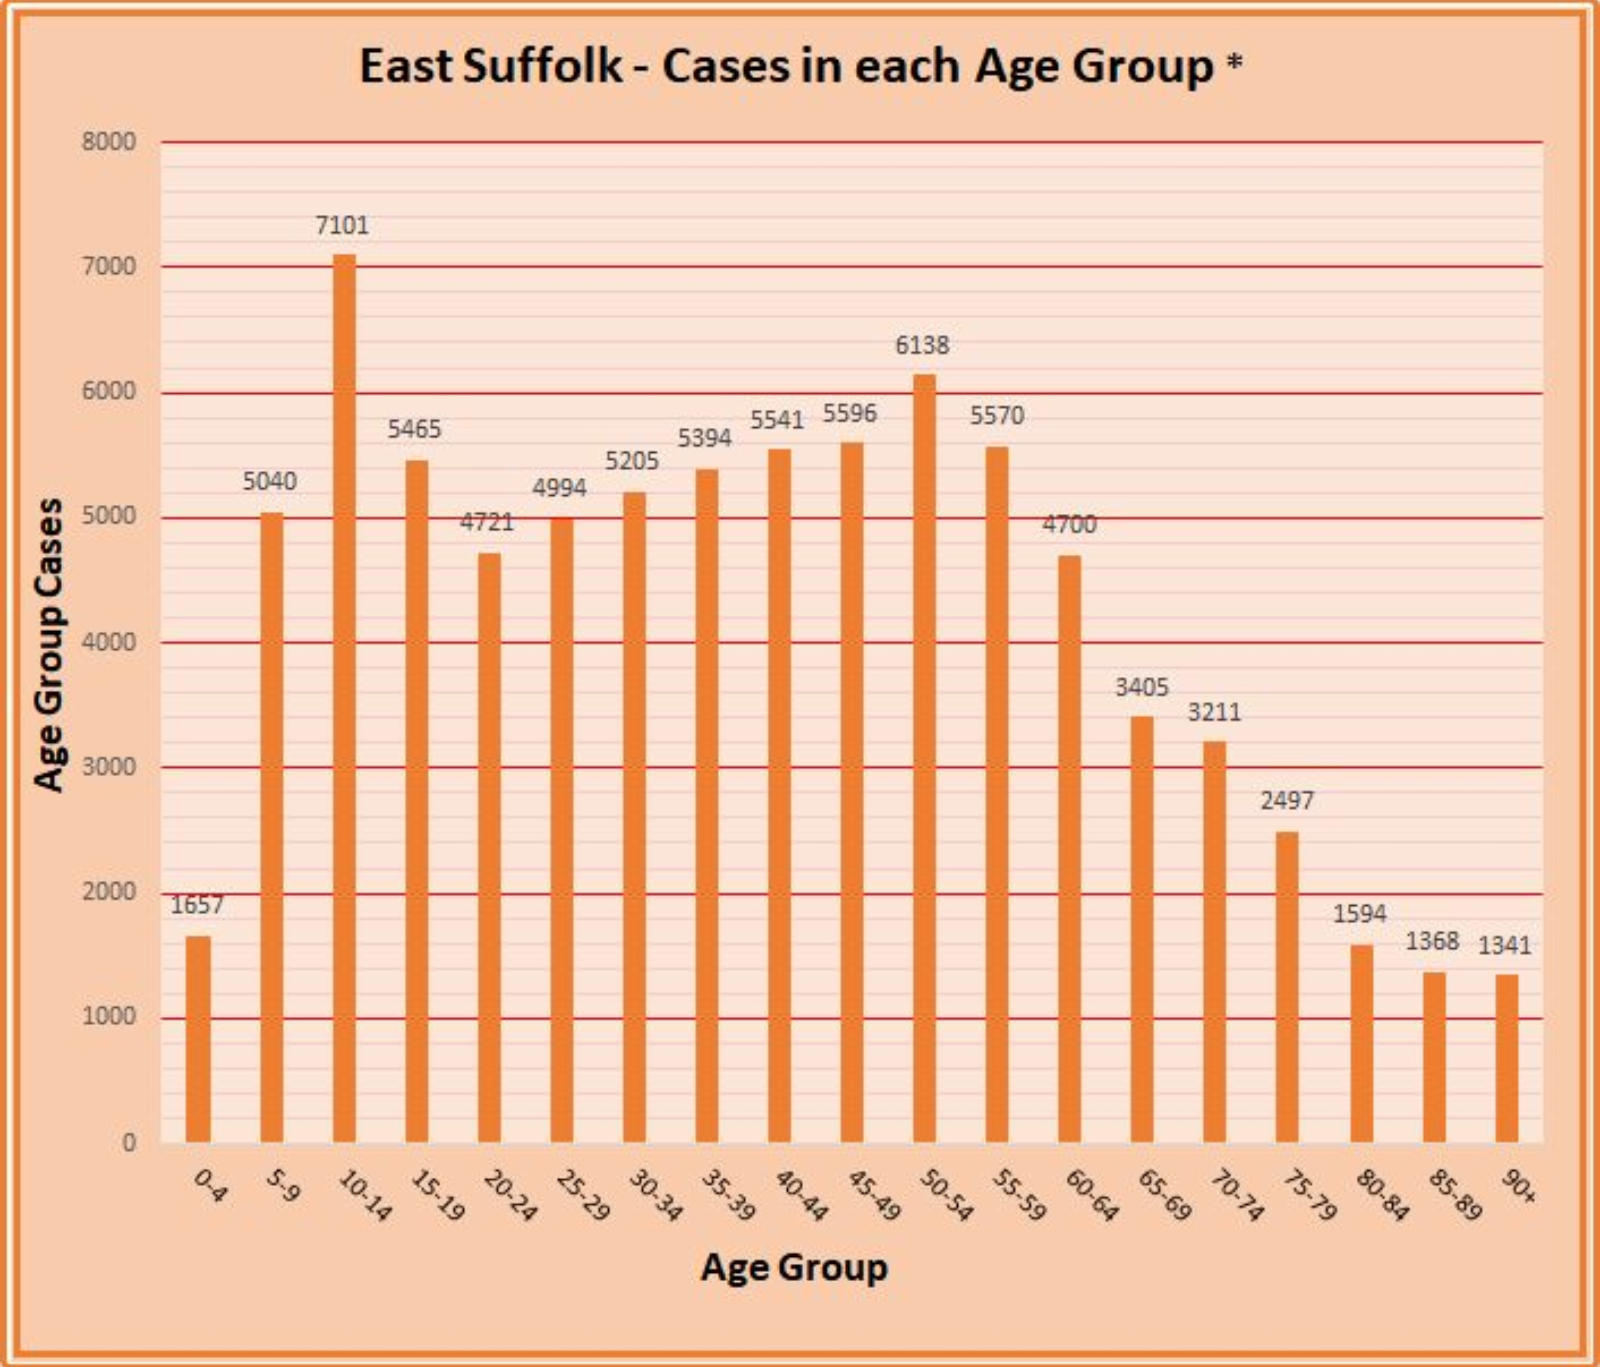
The cases in each age group are displayed below in a bar graph format.
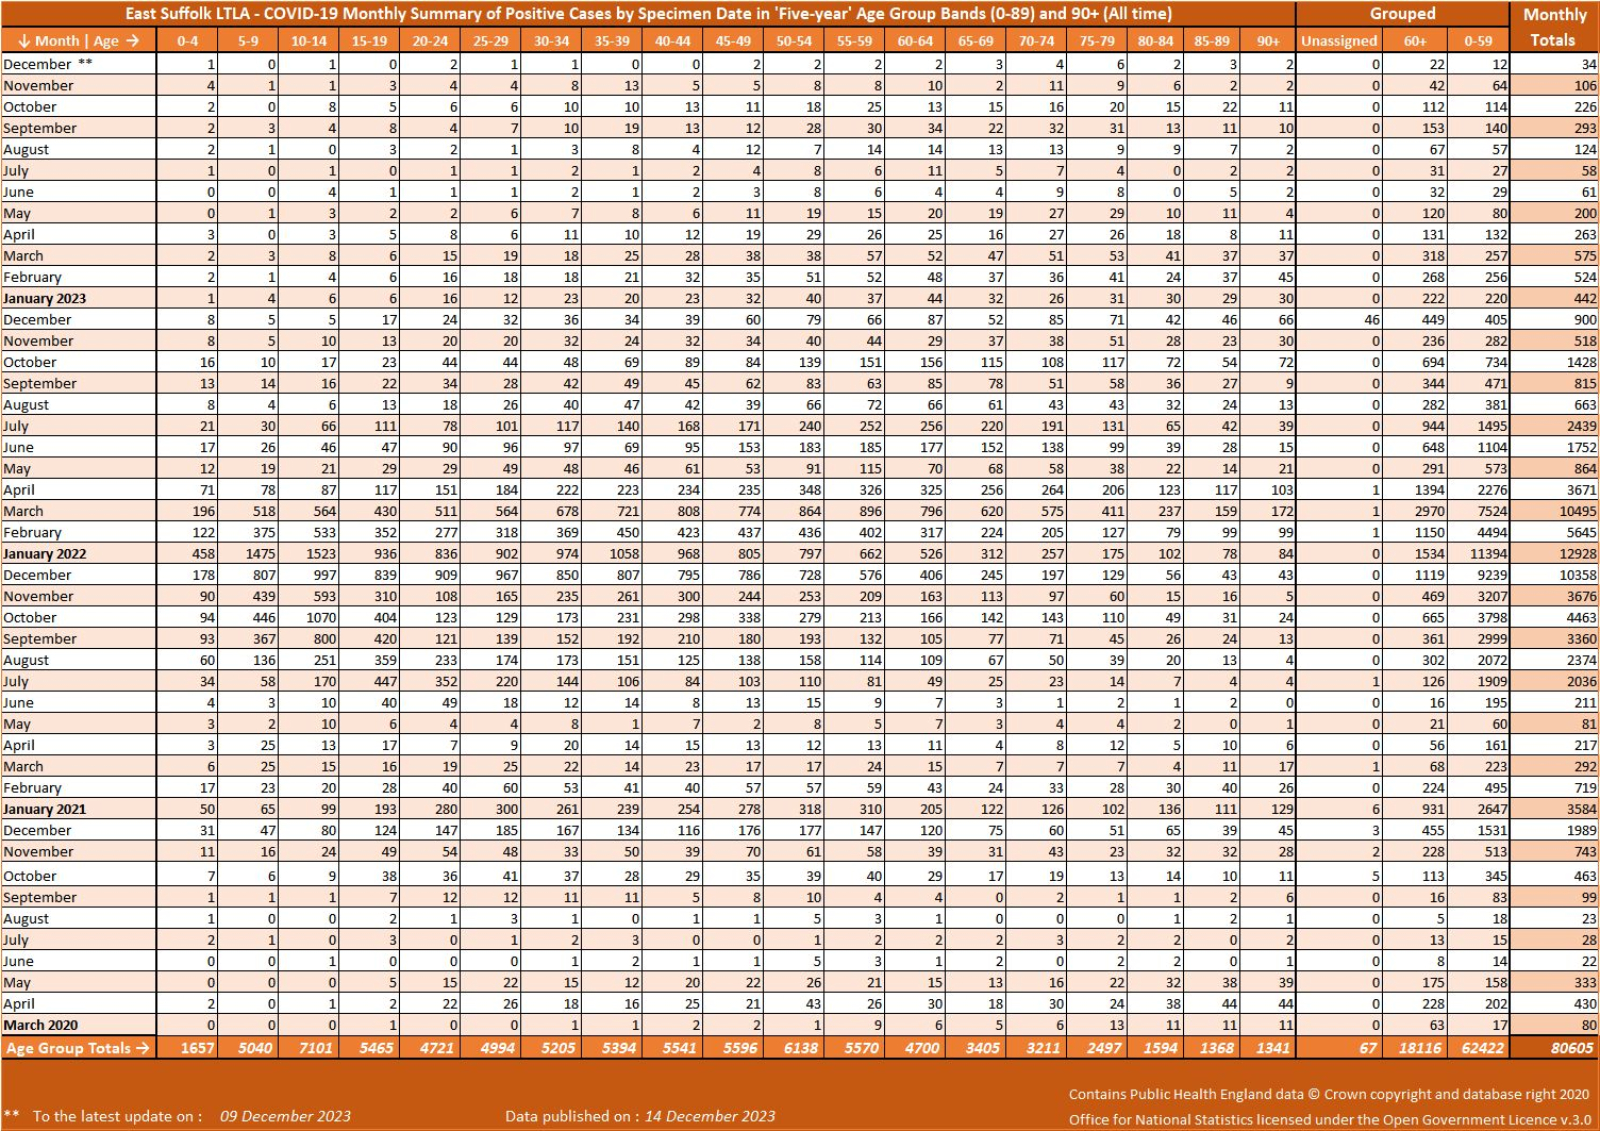
The chart below shows all cases by month in 5-year age groups since the first case in March 2020.
The full list of data from the first case is included in the relevant Excel Workbook which can be accessed as a
‘read only’ document in a browser window from the ‘LINKS’ page in the navigation bar.
The updating of the charts/graphs on this page has now ceased as the data for them is no longer available.


CASES BY AGE GROUP
Charts and Graph of all cases.
This following chart shows the latest seven days cases in five- year age groups along with the infection rate within each group.
Covid-19
in East Suffolk
Contains MSOA names © Open Parliament copyright and database right 2020.
Contains Public Health England data © Crown Copyright and databases right 2020 .
Office for National Statistics licensed under the Open Government Licence v.3.0
Disclaimer: Whilst every effort has been made to ensure the data published on these
pages is accurate, I cannot accept responsibility for any inaccuracies in the data used
to compile the graphs and charts.
© 2020 - 2025

The following chart is a summary of all cases by age
group and displays comparison statistics between
the groups.
The cases in each age group are displayed below in
a bar graph format.

The chart below shows all cases by month in 5-year
age groups since the first case in March 2020.
The full list of data from the first case is included in
the relevant Excel Workbook which can be accessed
as a ‘read only’ document in a browser window from
the ‘LINKS’ page in the navigation bar.
The updating of the charts/graphs on this page has
now ceased as the data for them is no longer available.